The Herd performance tile shows the percentage of animals in the herd that display unusual behavior.
Use the herd performance trend to detect changes in behavior and improve your farm management.
The Graph Explained
The graph includes all animals with unusual behavior, even if they do not yet have a health attention. An icon in the upper-right corner indicates the performance trend.
 Positive trend: Yesterday's number of animals with unusual behavior is lower than the average of the previous days.
 Neutral trend: Yesterday's number of animals with unusual behavior is equal to the average of the previous days.
 Negative trend: Yesterday's number of animals with unusual behavior is higher than the average of the previous days.
How To Interpret the Herd Performance Trend
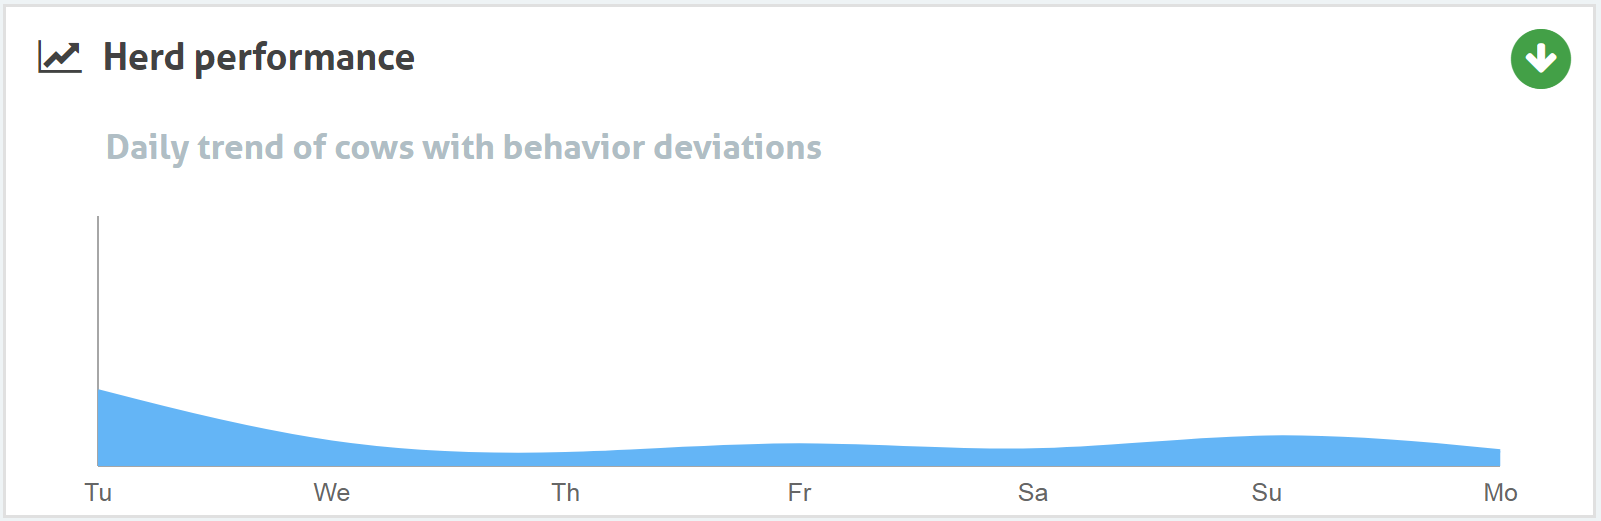
Aim for stable animal behavior. Use the herd performance trend to detect and respond to behavior changes. Ideally, the graph remains relatively flat and shows only a small number of behavior changes.
The system also alerts you when a certain percentage of cows in a group show abnormal behavior compared to their previous behavior. You can find them on the Animals to check page with the group alert icon.
See the picture below for an example of a farm with a stable and good herd performance.