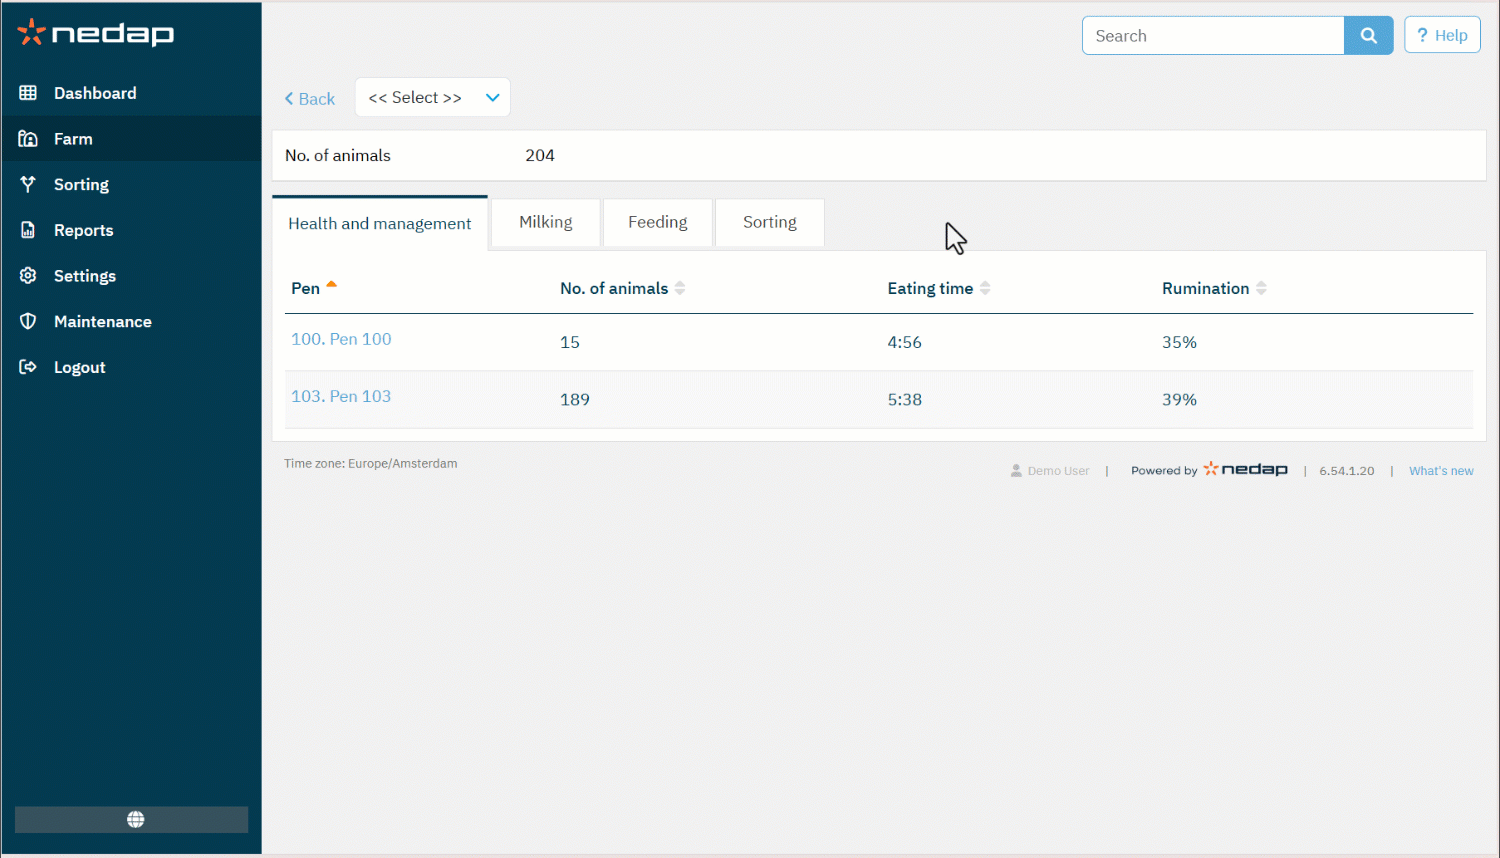
The Health and monitoring tab on the Farm page shows herd performance graphs for a specific pen.
These graphs help you monitor eating, ruminating, and inactivity patterns over time. Use this information to support management decisions related to feed quality, feeding times, feed availability, and feed push moments.
- Select Farm from the menu.
- Select a pen from the dropdown menu.
- Select the Health and management tab.
NoteIf no pen is selected, the graphs are not displayed.
Available Graphs
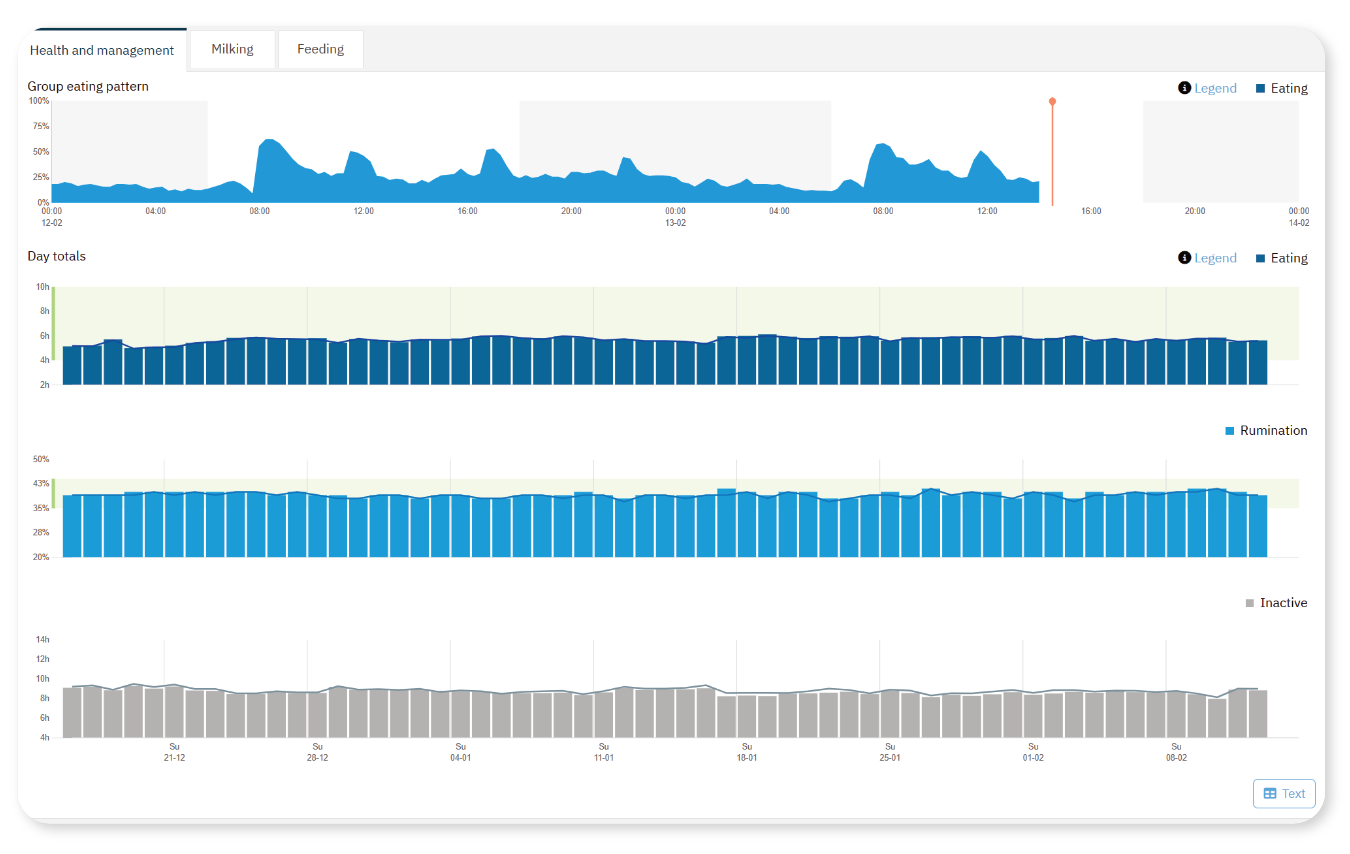
The Health and management tab displays four graphs for the selected pen.
- Group eating pattern: The percentage of animals that are eating during a 24-hour period.
- Daily totals graphs: The time per day animals spend eating, ruminating or inactive.
Group Eating Pattern
The Group eating pattern shows the herd’s eating behavior over time. Review this graph regularly to understand normal herd behavior and detect changes early.
- The percentage indicates how many animals are eating at that time. A 100% score means all animals are eating.
- A sudden drop may reflect a short-term disruption, like a milking moment.
- A gradual decline could signal structural issues, such as feed access.
Examples
Low consistency
Every day, feeding is around 8:00 AM, and pushed twice during the day: around 12:00 PM and 8:30 PM. There are several moments in the day that nearly any cow is eating, or many cows are eating. This inconsistency is related to the overall herd behavior regarding inactivity and ruminating.

High consistency
Below a graph of a consistent Group Eating Pattern, split up into the eating, ruminating, and inactive behavior of the whole group of animals that day.

