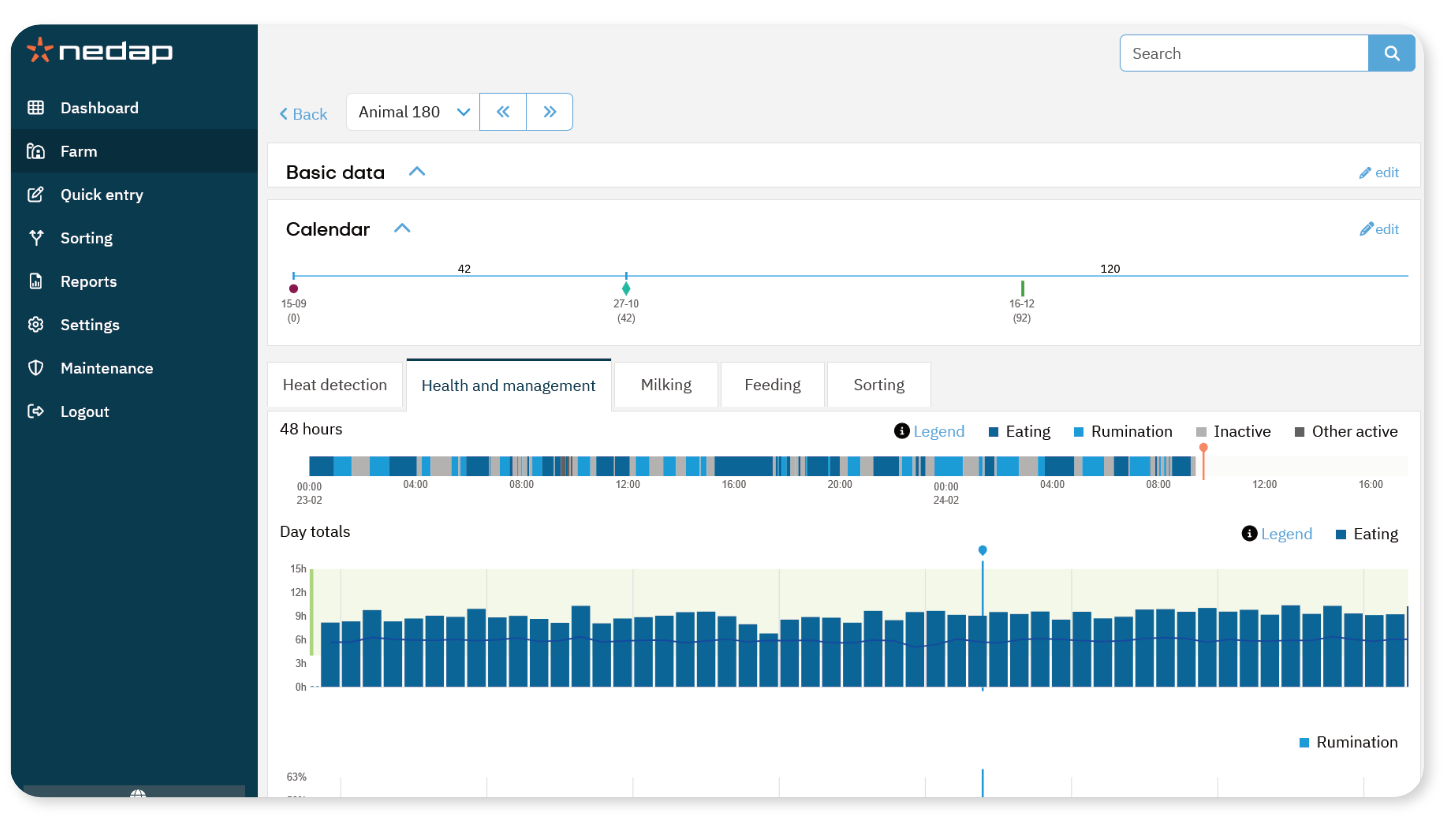
The Health and management tab shows behavior and health trends for an individual animal. This tab helps you assess the animal’s well-being over time and identify changes that may require action.
Where to Find the Health and Management Tab
The health and management tab for a specific animal can be found on the animal details page. You can open it by searching for an animal using the Search field or by opening the animal details from a list.
- Select the Search field at the top of the screen.
- Enter the animal number.
- Press Enter or select the search icon.
- Select the Health and management tab.
The page displays one detailed 48 hours graph and three daily graphs.
Important events, such as calving and group changes, are shown as icons above the daily graphs.
These markers help you relate behavior changes to management events.
48-hours Behavior Overview
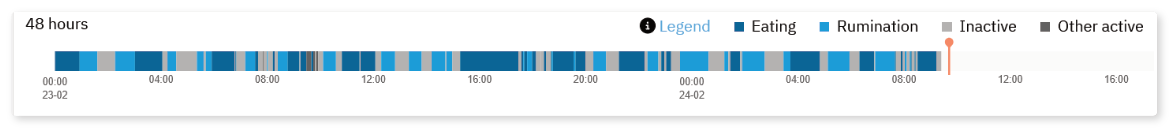
The top section shows a 48-hour behavior overview.
- Colored blocks represent behavior:
- Eating
- Ruminating
- Inactive
- Other active
- The width of each block represents duration.
- Urgent health issues are marked with a red line above the timeline.
Use this view to assess recent behavior patterns in detail.
Day Totals
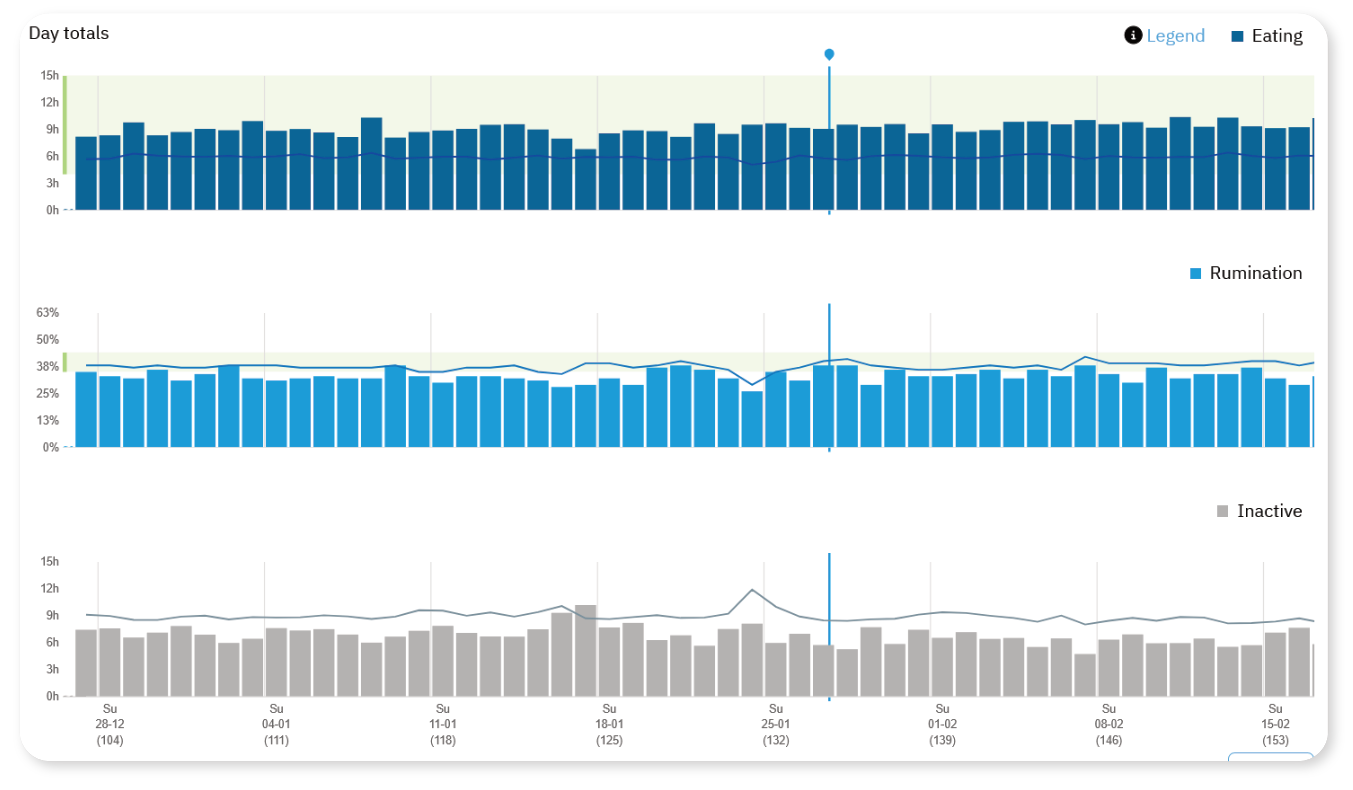
Day totals - Eating
This graph shows the total number of hours per day the animal spends eating.
The bars represent daily totals.
The line shows the Pen average.
The green area indicates the optimal range.
A decrease in eating may indicate a developing health issue.
Day totals - Ruminating
This graph shows the percentage of time per day the animal spends ruminating.
The bars represent daily totals.
The line shows the trend over time.
The green area indicates the optimal range.
A decrease in rumination may signal stress or illness.
Day totals - Inactive
This graph shows the number of hours per day the animal is inactive. Inactivity includes standing rest, lying rest, and sleep.
An increase in inactivity may indicate health problems.
How to Interpret the Graphs
- Compare trends over time (7-60 days).
Look for sudden drops or gradual changes.
Use the 48-hour overview to confirm recent behavior.
Always assess multiple behavior trends together, not separately.
Consistent monitoring helps detect health issues at an early stage.
