The Behavior graph gives a detailed view of group-level behavior for a specific pen.
It helps you track eating, ruminating, and inactivity patterns over time and identify when changes begin.
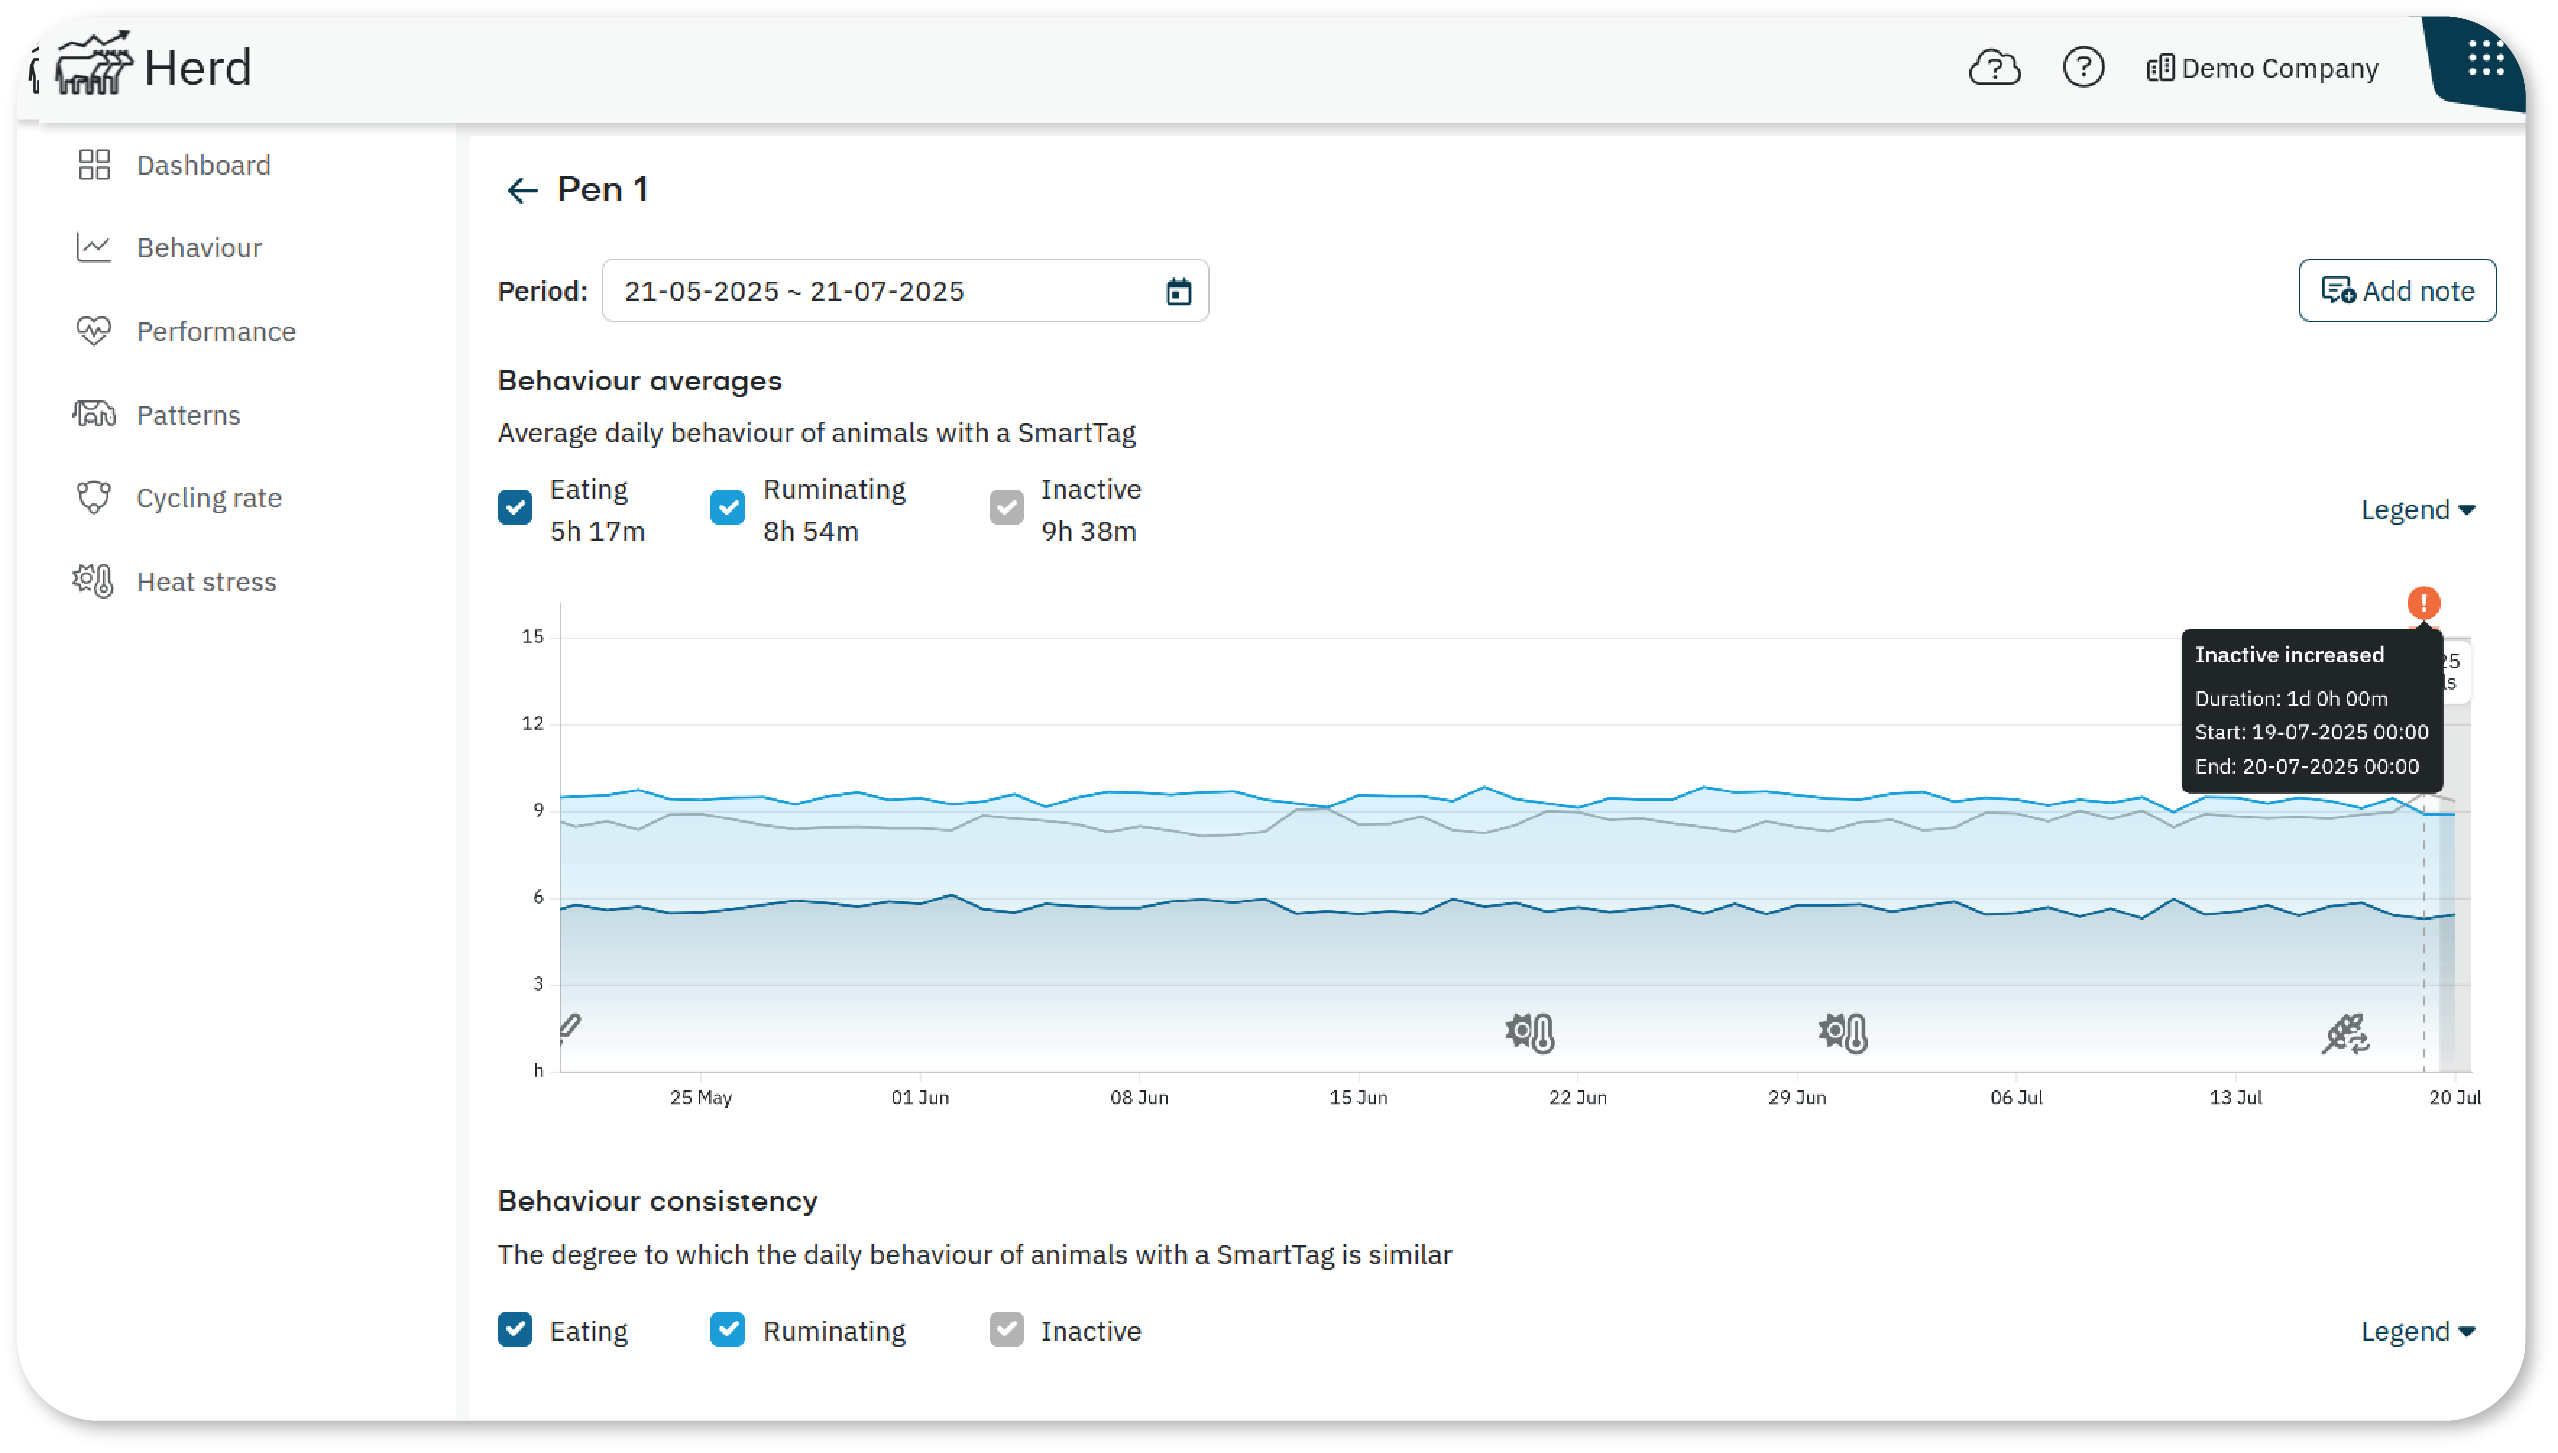
The behavior graph consists of the following elements:
- Line graph: Shows daily averages and consistency scores for eating, ruminating, and inactivity over the past 60 days.
- Pen alerts: Highlights days with abnormal behavior using orange indicators above the graph. Hover over each alert to view the type of issue, along with its start and end date.
- Date time Selector: Use the calendar at the top of the graph to select a specific time period. You can choose from predefined ranges (e.g., past month) or set custom start and end dates to analyze trends over time
TipUse the checkboxes to show or hide each behavior line. This lets you focus on specific trends.
Accessing the Behavior and Consistency graphs
To open the graphs:
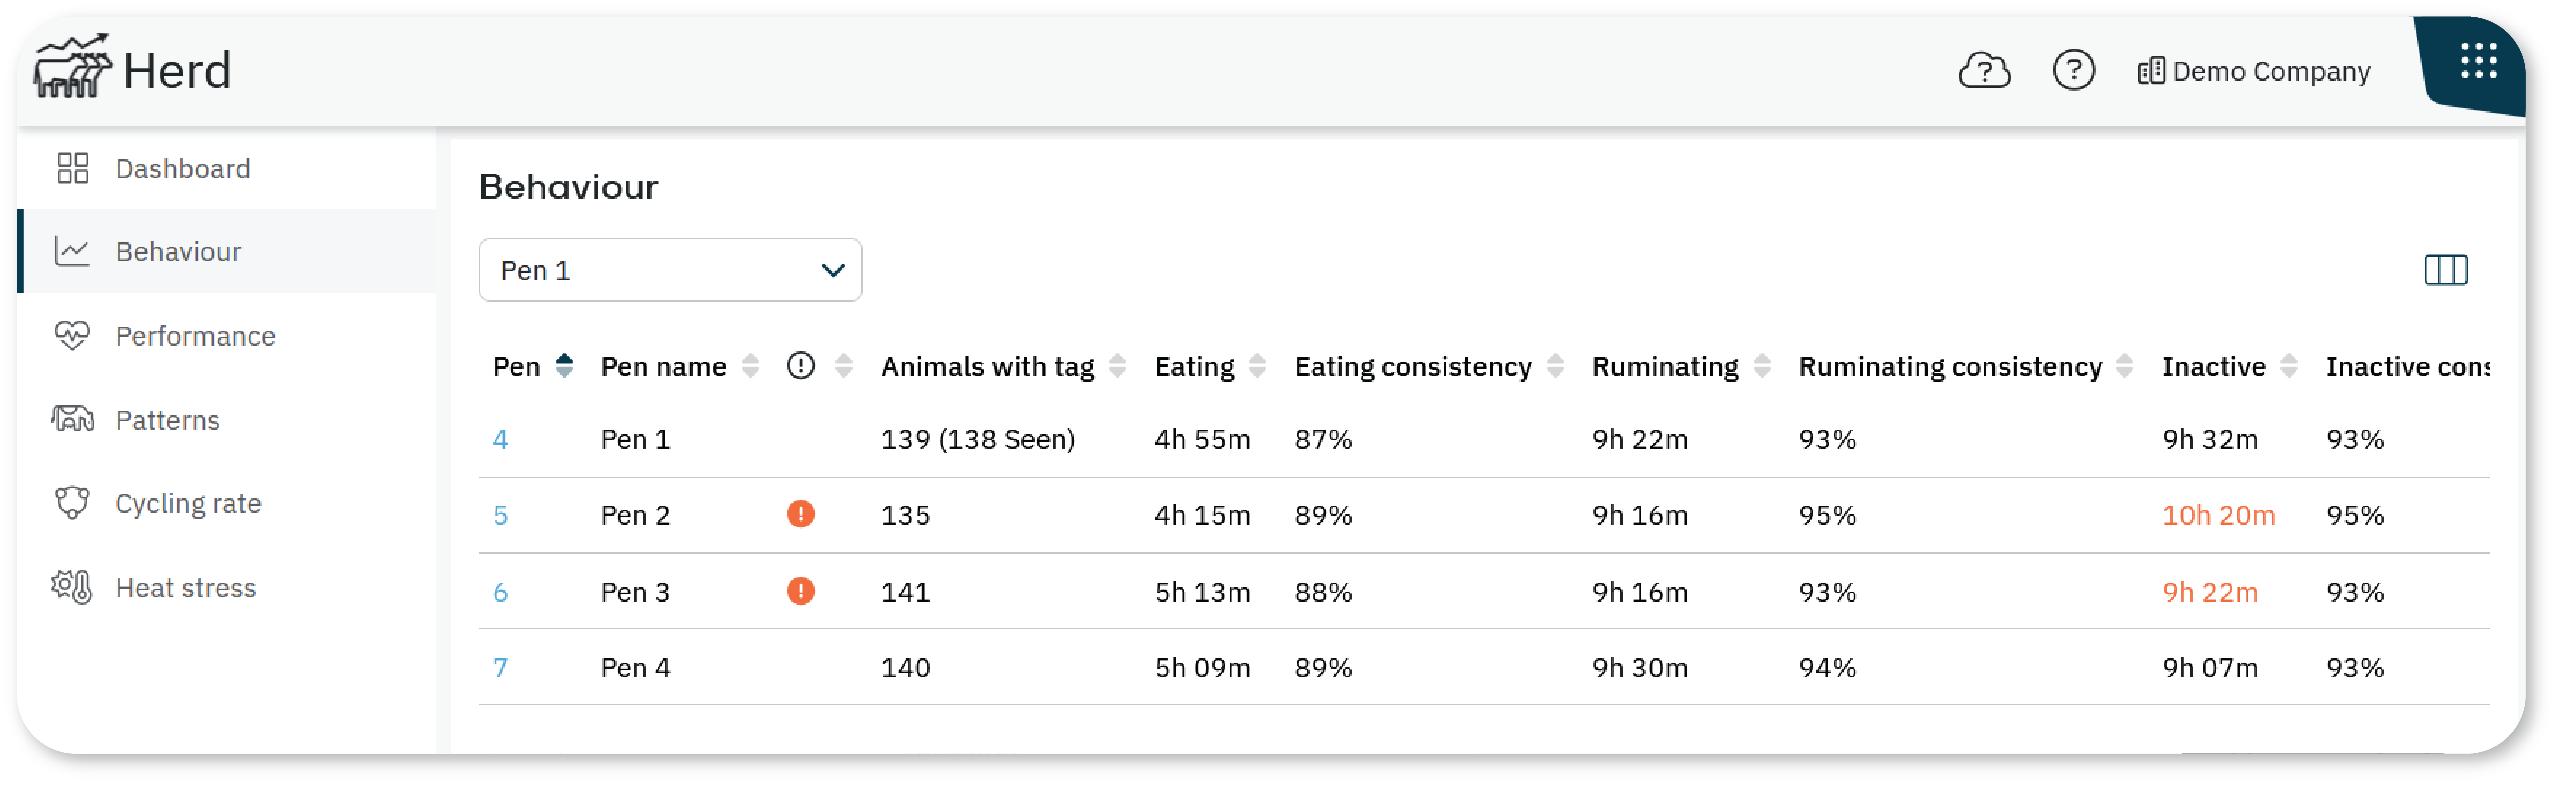
Open the Herd app and go to the Behavior tab.
Select a pen row to view average behavior values across all animals in the pen.
Select a specific Pen Number to view both average behavior and consistency graphs.
Using the Behavior Graph
Use the graph to monitor and analyze behavior patterns:
Track eating (dark blue), ruminating (light blue), and inactivity (gray) trends.
Use checkboxes to focus on one or more behaviors.
Compare consistency scores for different behaviors.
Look for sudden drops or gradual changes to spot early signs of issues.
Understanding Consistency Scores
Consistency scores measure how similarly animals behave within the pen. High consistency indicates stability and effective management.
A 100% score means animals show similar patterns.
A sudden drop may reflect a short-term disruption.
A gradual decline could signal structural issues, such as feed access.
Review the consistency graph regularly to understand typical behavior in your herd. Early detection of changes helps you act quickly to maintain animal health and performance.
