The Patterns tab helps you monitor when animals are eating, ruminating, or inactive throughout the day.
It displays current behavior against typical behavior over the past 10 days.
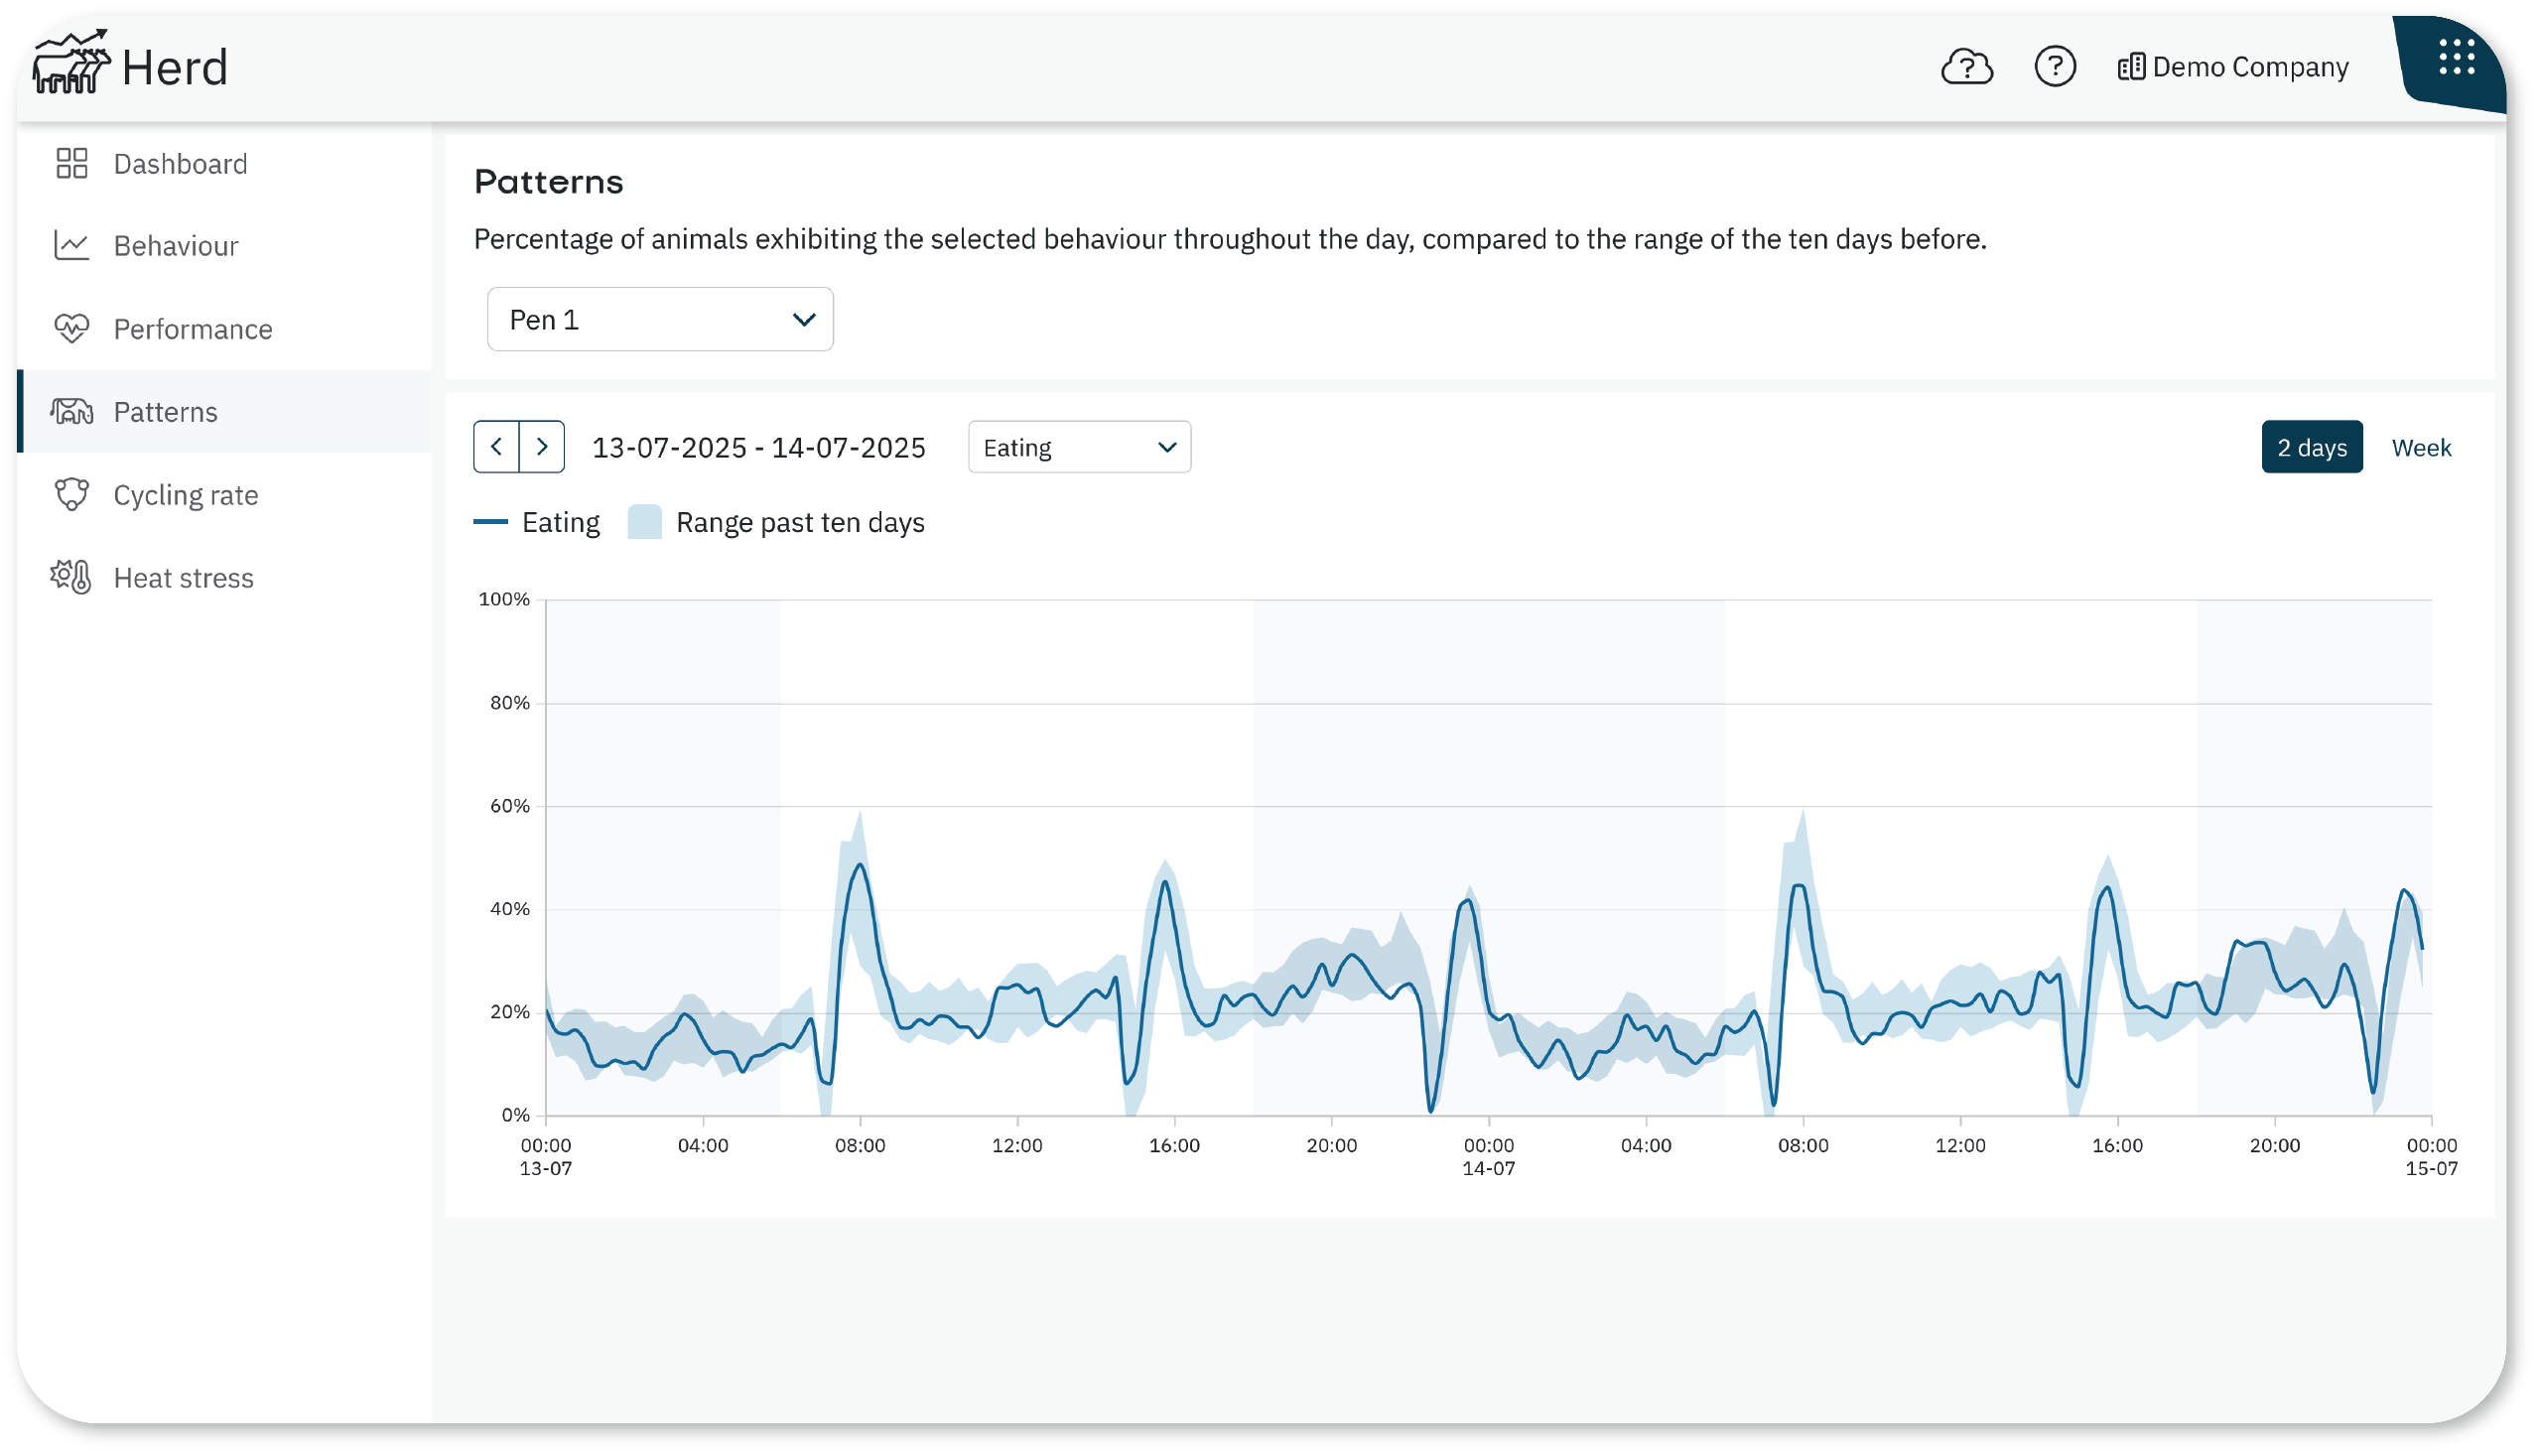
What You See in the Patterns Graph
- Behavior percentage
Shows the percentage of animals eating, ruminating or inactive at a specific time of the day.
Hover over the graph to view the percentage and number of animals for each time frame. - Shaded range
Represents the typical range from the past 10 days. - A narrow shaded area indicates consistent behavior.
- A wider area suggests more variation.
- Line graph
Shows the behavior for the selected time frame. If the line stays within the shaded range, the behavior is in line with recent patterns. - View
Choose between a 2-day or Week view to compare behavior patterns over time.
How to Use the Patterns Tab
Use the drop-down menu above the graph to select a behavior: eating, ruminating, or inactive.
- Check if the current behavior line stays within the shaded area.
Use the data to verify if the behavior changes align with changes in housing, group structure, or routine.
Example: Spotting a Change in Feed Timing
You open the patterns tab and select Eating behavior for Pen 5.
Normally, animals begin eating around 6:00 a.m., confirmed by a narrow shaded range starting after feeding.
Today, the eating curve is delayed, peaking at 7:30 a.m., with fewer animals eating at 6:00 a.m. The behavior line falls outside the shaded range.
You investigate and discover feed was delivered later than usual. Use the Patterns tab to monitor whether the shift in eating times affects rumination, consistency, or performance in the coming days.
