The Behavior tab in the Herd app shows how the animals are behaving on a daily basis. It helps to assess the stability of the herd by showing averages and consistency scores for eating, ruminating, and inactivity.
What You See on the Behavior Tab
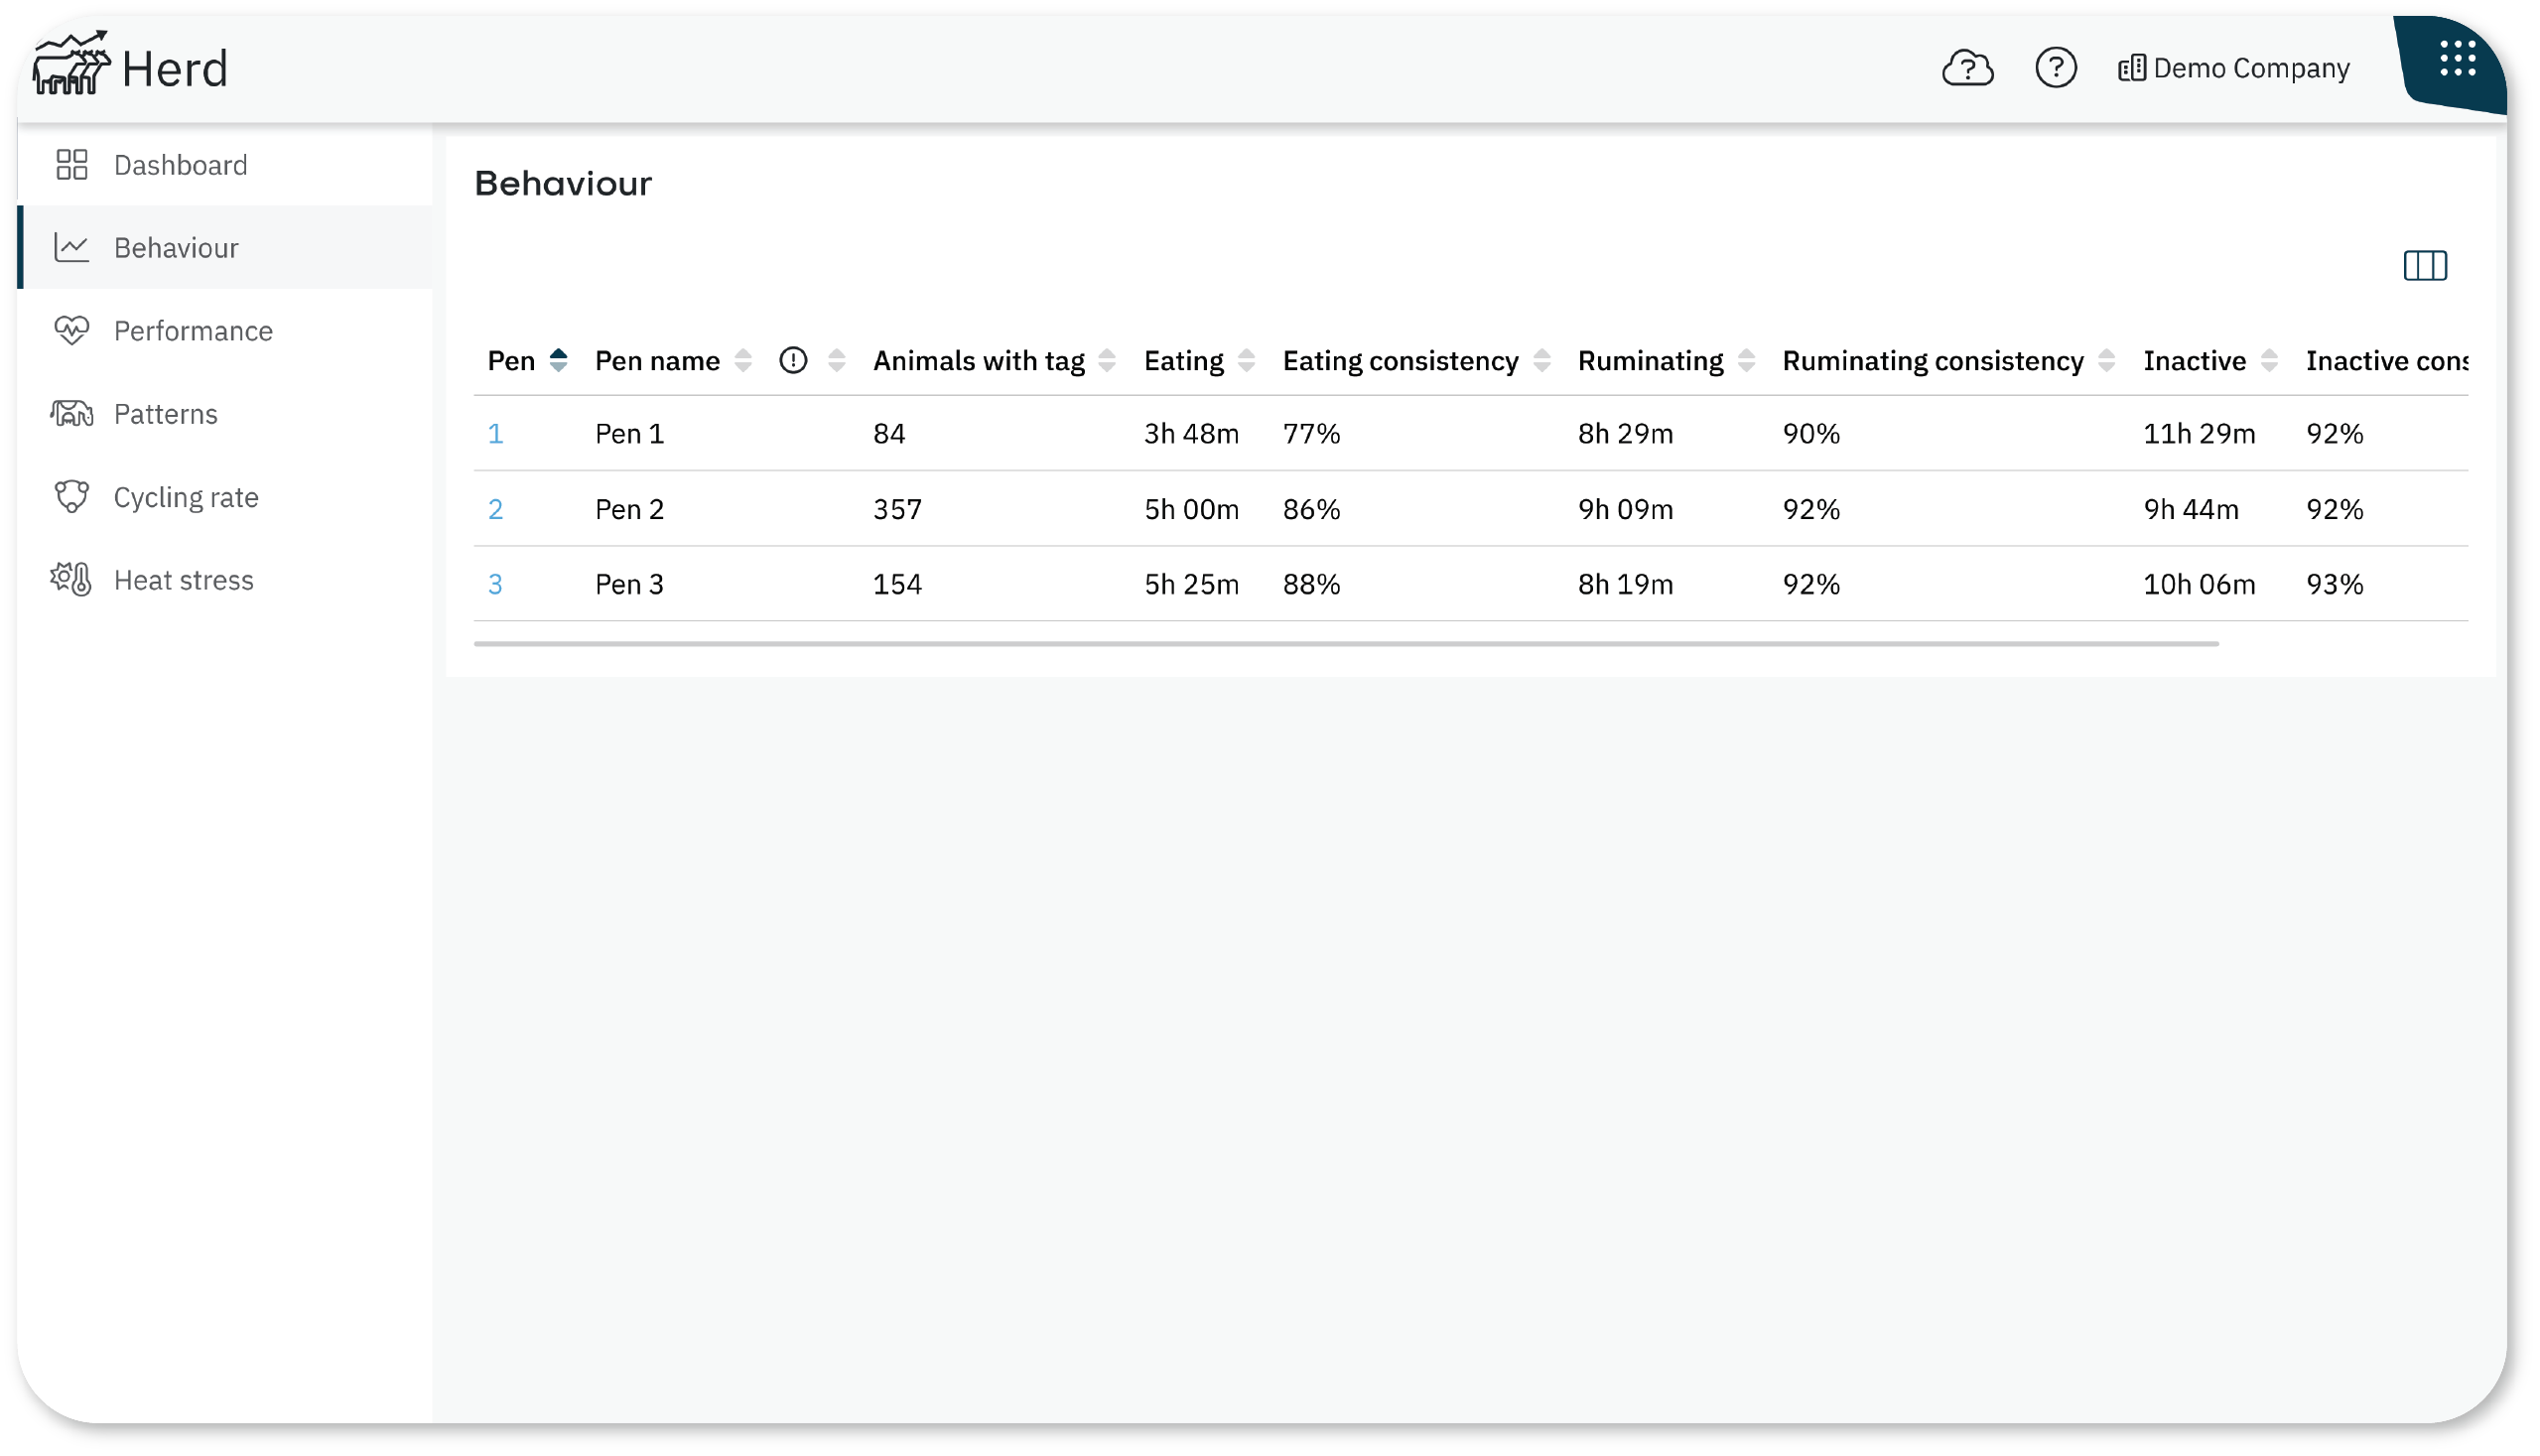
For each pen the following data is shown:
- Average behavior times
The number of hours per day animals spend eating, ruminating, or inactive. - Consistency scores
The percentage of animals with similar behavior patterns. A 100% score means all animals in the pen behaved the same way. - Pen alerts
A warning icon appears next to values when their behavior deviates significantly from normal.
To view more data, open the Behavior Graph for behavior averages, or select a specific Pen Number to see both the behavior averages as the behavior consistency per pen.