The Cycling rate tab shows the percentage of cows that are showing signs of heat during their voluntary waiting period (VWP). Use it to monitor fertility trends and check whether cows are returning to a normal reproductive cycle after calving.
What You See in the Cycling Rate Tab
The Cycling rate tab shows how quickly cows start showing signs of heat after calving.
- Cycling rate over time
Shows the percentage of cows that were showing signs of heat at the end of their voluntary waiting period (VWP), - Cycling rate per DIM
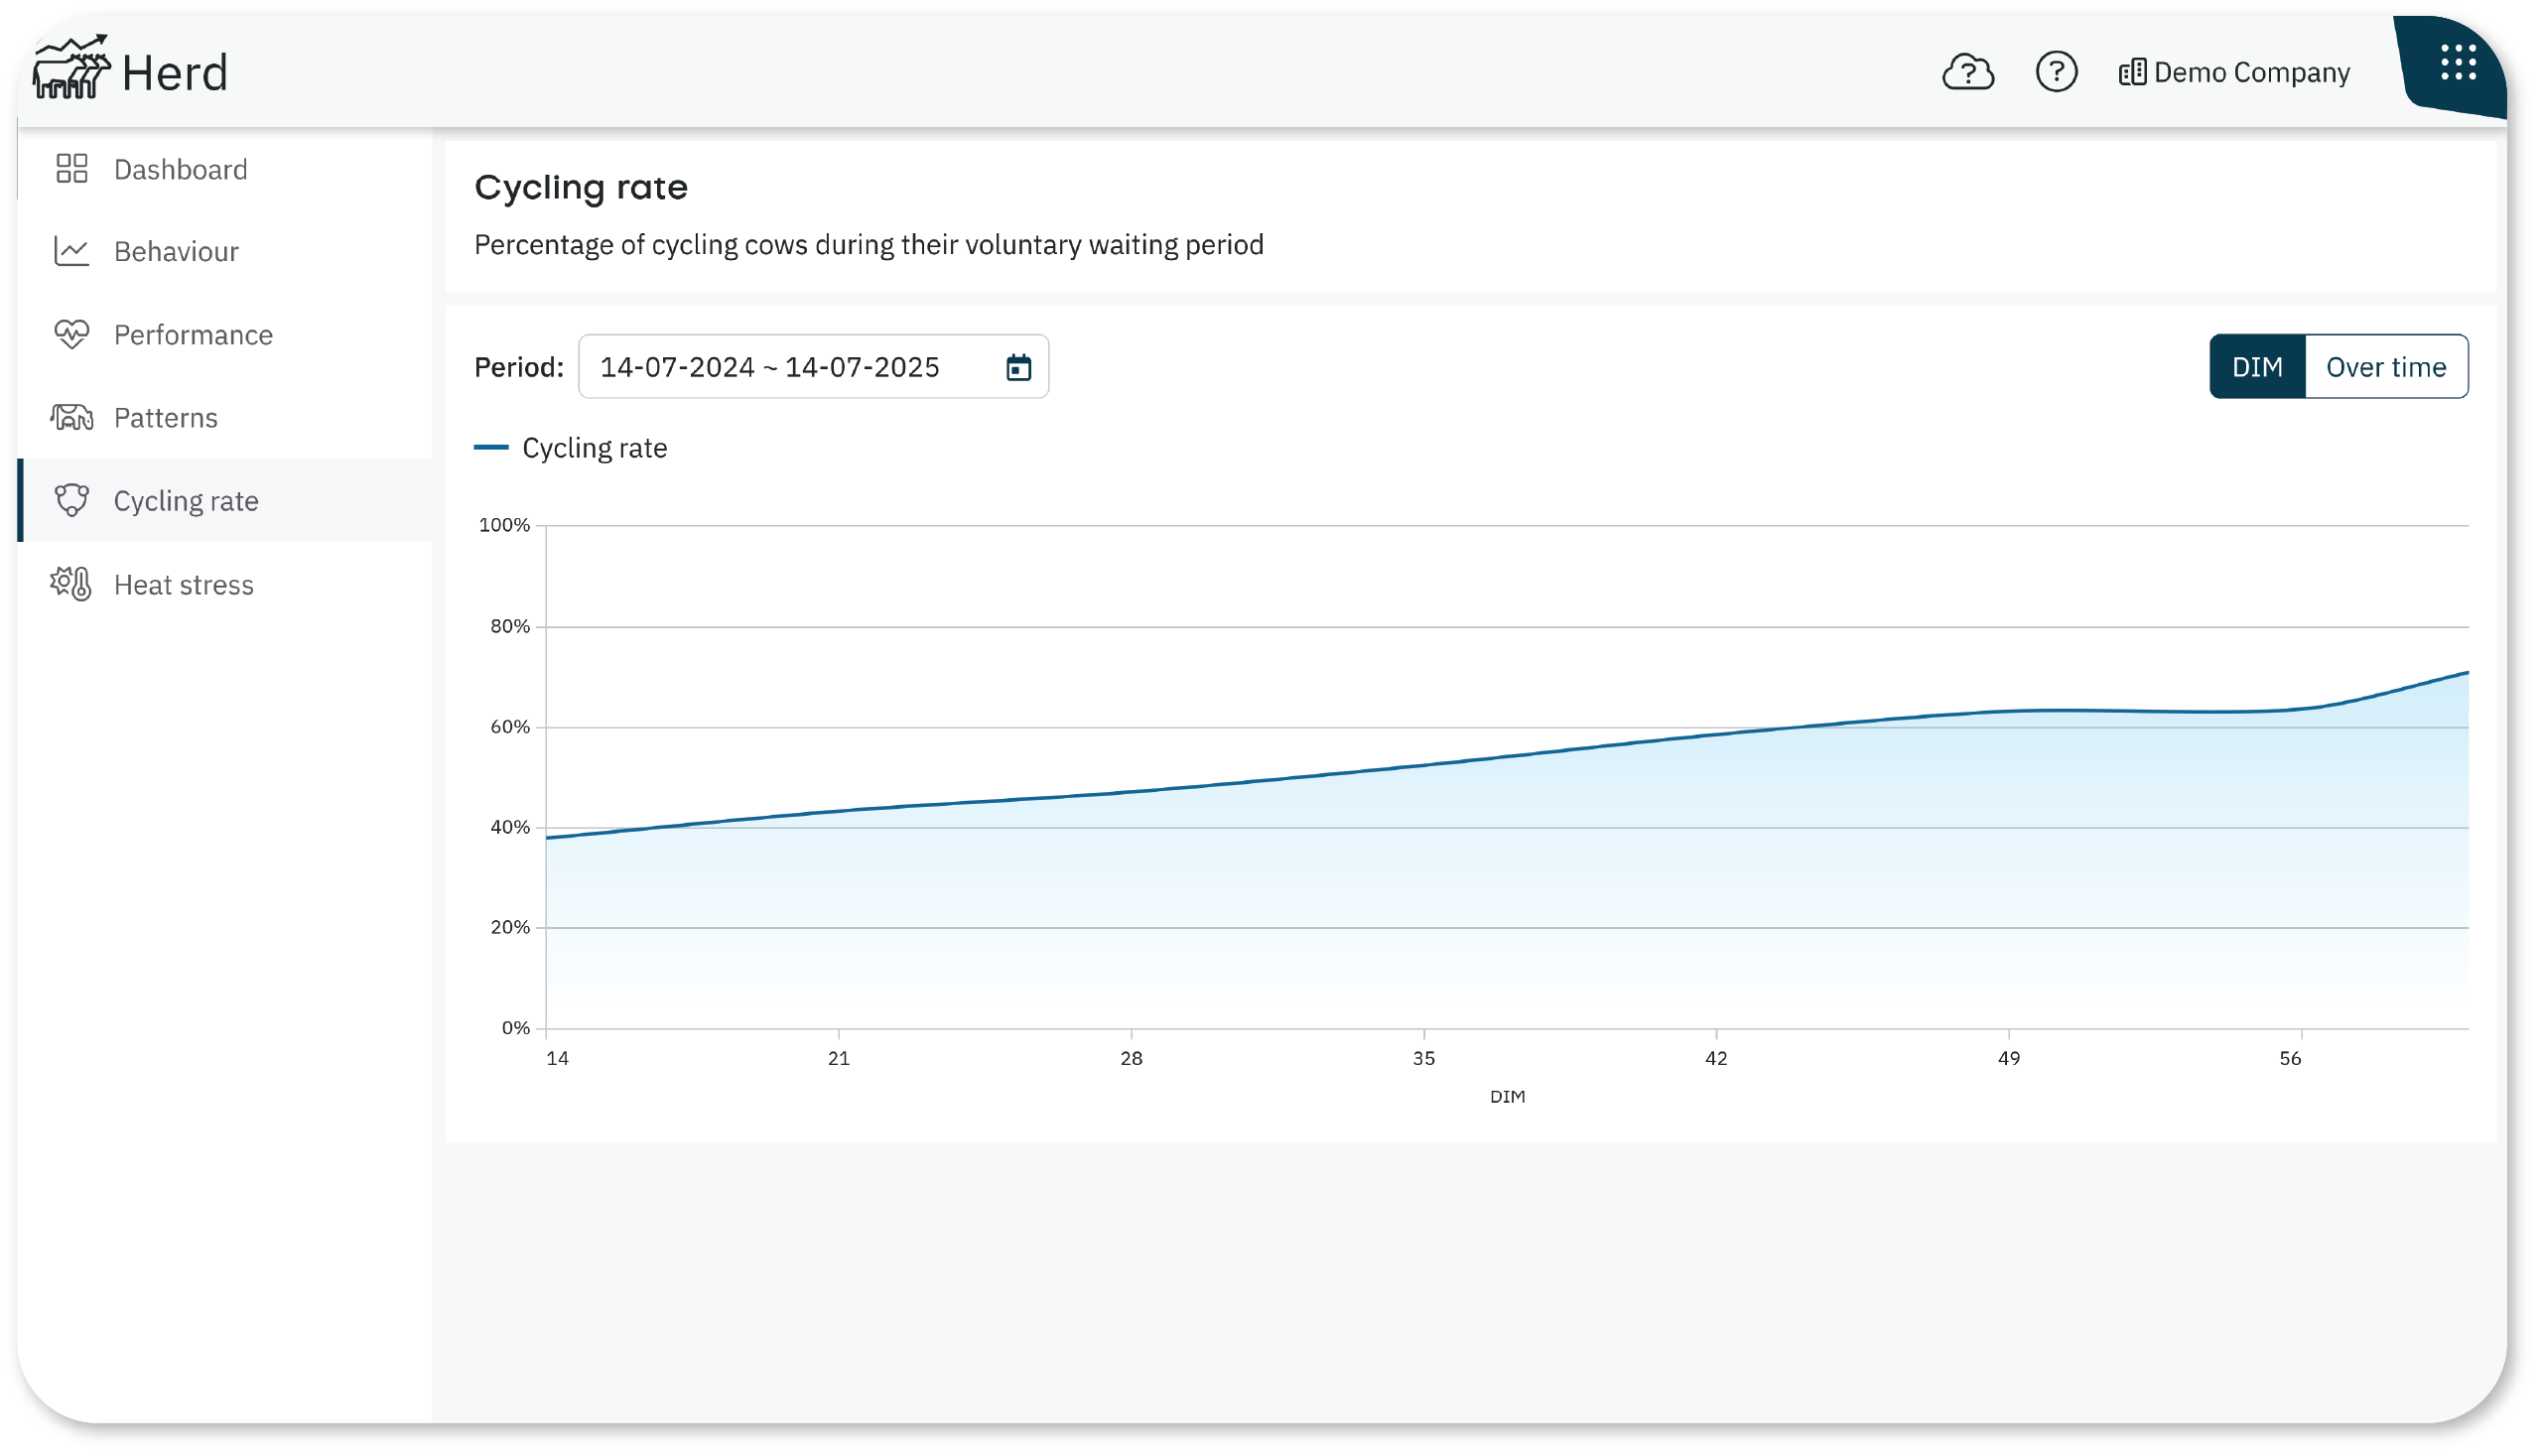
Shows the percentage of cows that were cycling at specific days in milk (DIM), from DIM 14 until the end of the VWP. - Date range selector: Use the calendar at the top of the graph to select a specific time period. You can choose from predefined ranges (e.g., past month) or set custom start and end dates to analyze trends over time.
How to Use the Cycling Rate Tab
Select Over time to track long-term fertility trends. A declining trend may indicate herd-level reproductive issues.
Select DIM to analyze how quickly cows resume cycling after calving.
Look for dips or gaps in the graph that could suggest delayed or disrupted cycling.
Hover over any point in the graph to see the exact percentage and the number of cows included.
