Use Locomotion in the Herd app to monitor lameness prevalence across pens and farms. Compare pens, identify changes over time, and review the effect of management interventions.
To monitor lameness trends:
- Compare lameness prevalence between pens.
- Analyze trends for the farm or an individual pen.
- Add notes to explain changes in the graph.
The Locomotion page provides insights at pen level. To identify and handle individual animals with a locomotion issue, use the Lameness checks worklist.
This feature is available for companies with SmartSight Locomotion Monitoring.
Understanding the data
An animal is included in the lameness prevalence when she received at least one locomotion score that day. She is counted in the pen in which she was registered at the end of the day.
For information about locomotion scores and classifications, see Understand Locomotion Score and the Locomotion Graph.
The page shows:
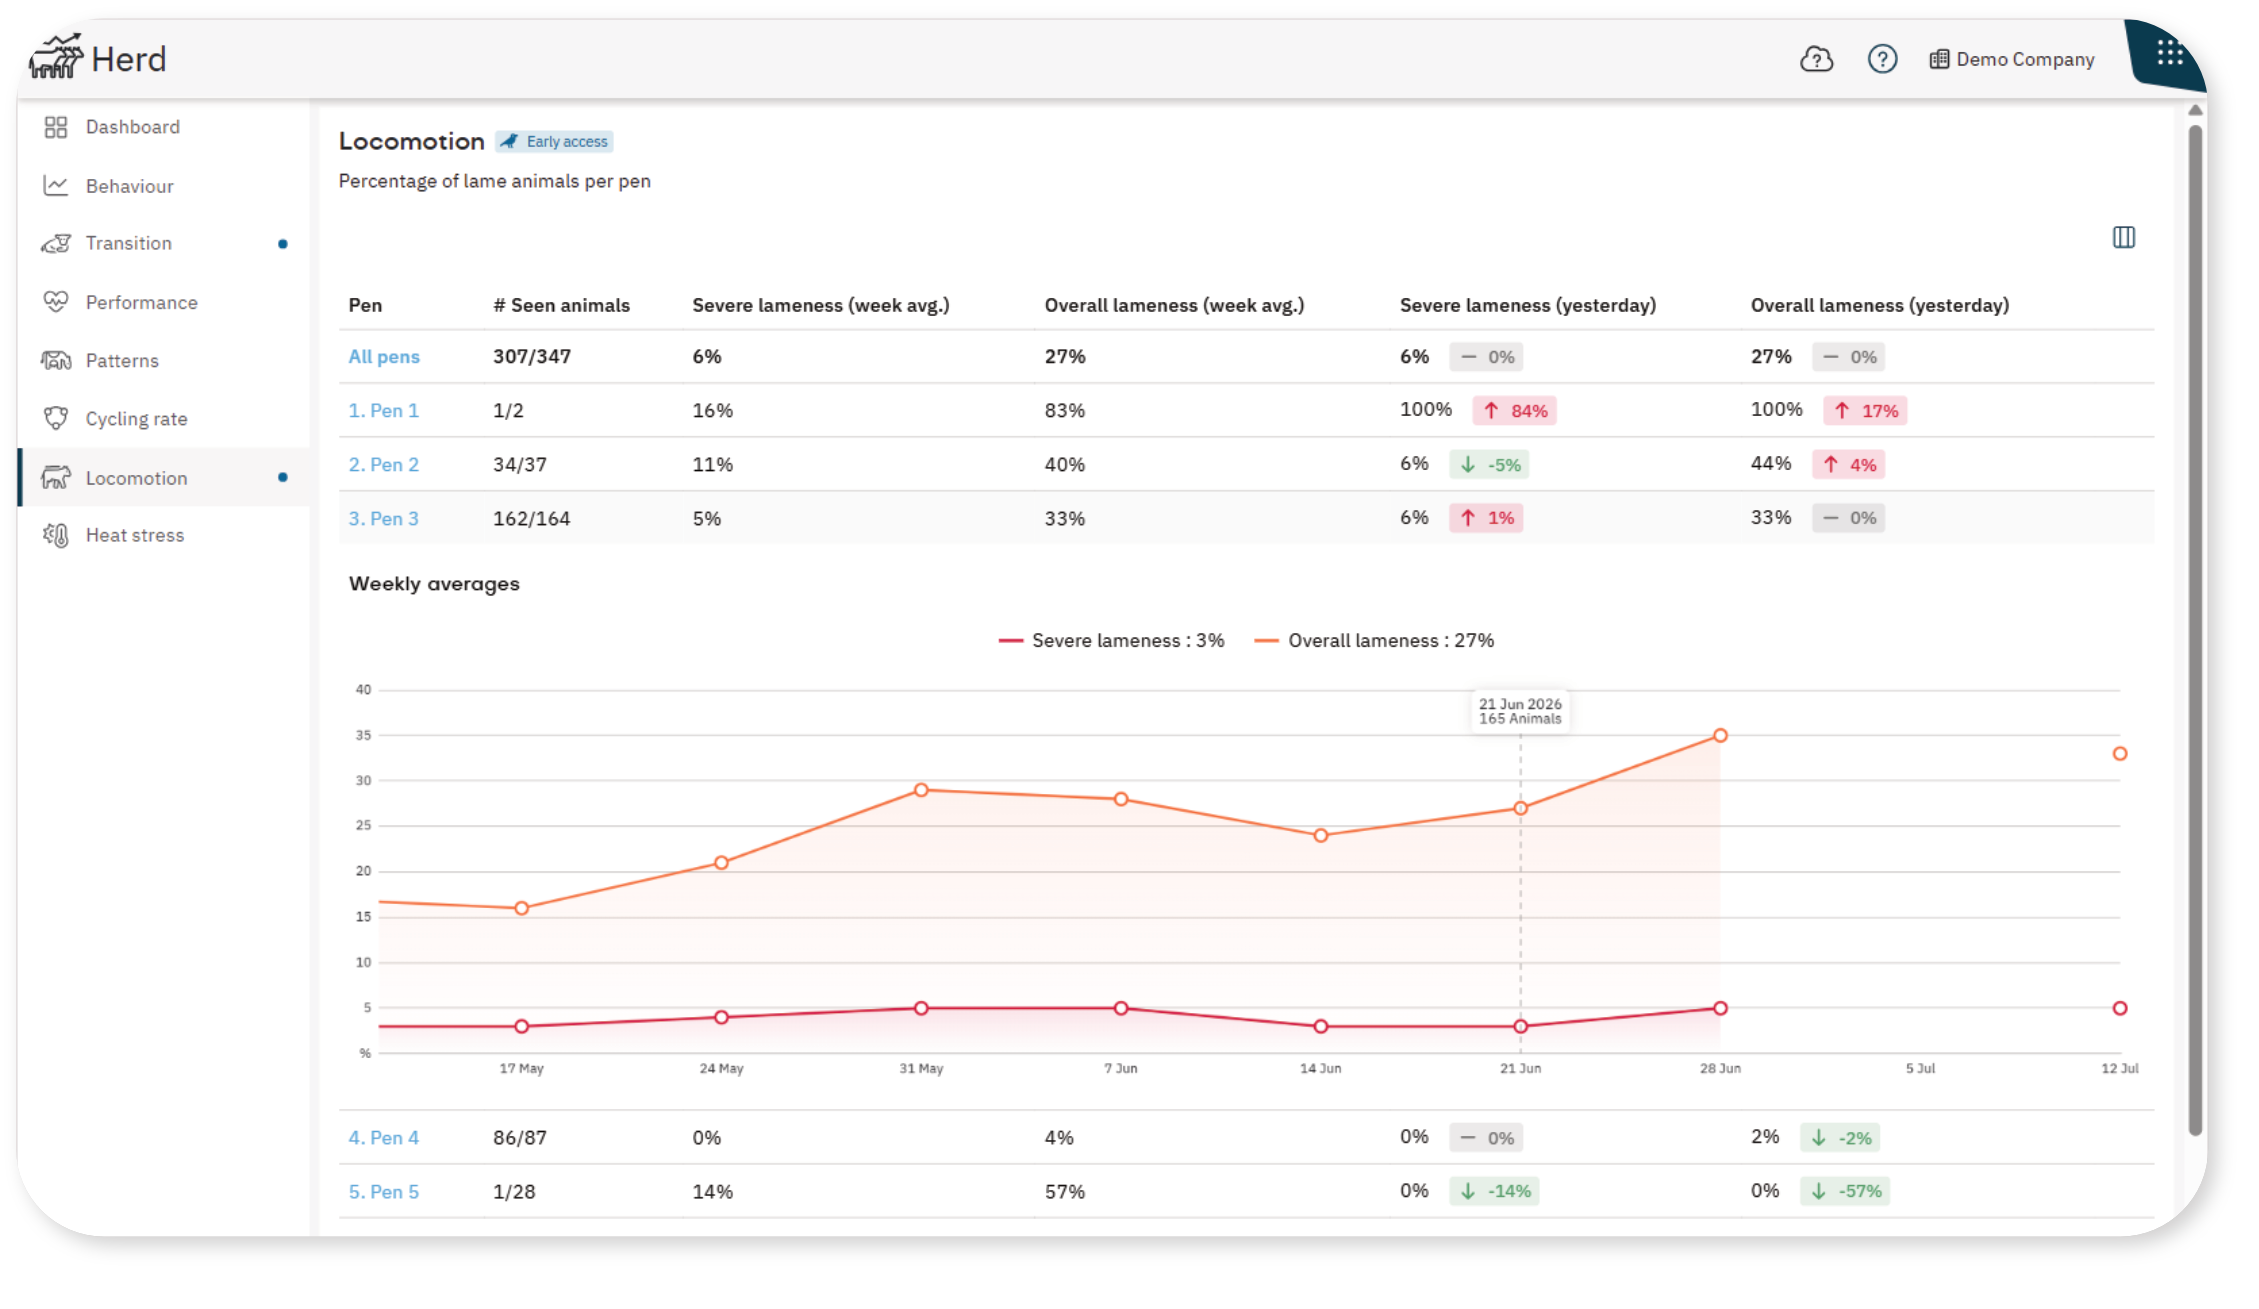
- # Seen animals: The number of animals with at least one locomotion score compared with the total number of animals registered in the pen. This reflects the data from yesterday (midnight to midnight).
- Severe lameness (week avg.): The average percentage of animals classified severely lame the past 7 days.
- Overall lameness (week avg.): The average percentage of animals considered lame the past week. This includes animals with severe lameness.
By default, the page shows the average over the past seven days.
NoteAny week needs at least three days of data to calculate an average. A gap is shown in the graph when no value could be calculated.
1. Compare pens
- Go to Locomotion in the Herd app.
- If the company contains multiple farms, select the farm you want to view.
- Compare the results for All pens with the results for the individual pens.
- Check the trend indicators to identify pens in which overall or severe lameness increased or decreased.
- To view the lameness rates for the previous day, you can add the columns:
- Severe lameness (Yesterday)
- Overall lameness (Yesterday)
2. Analyze Lameness Trends
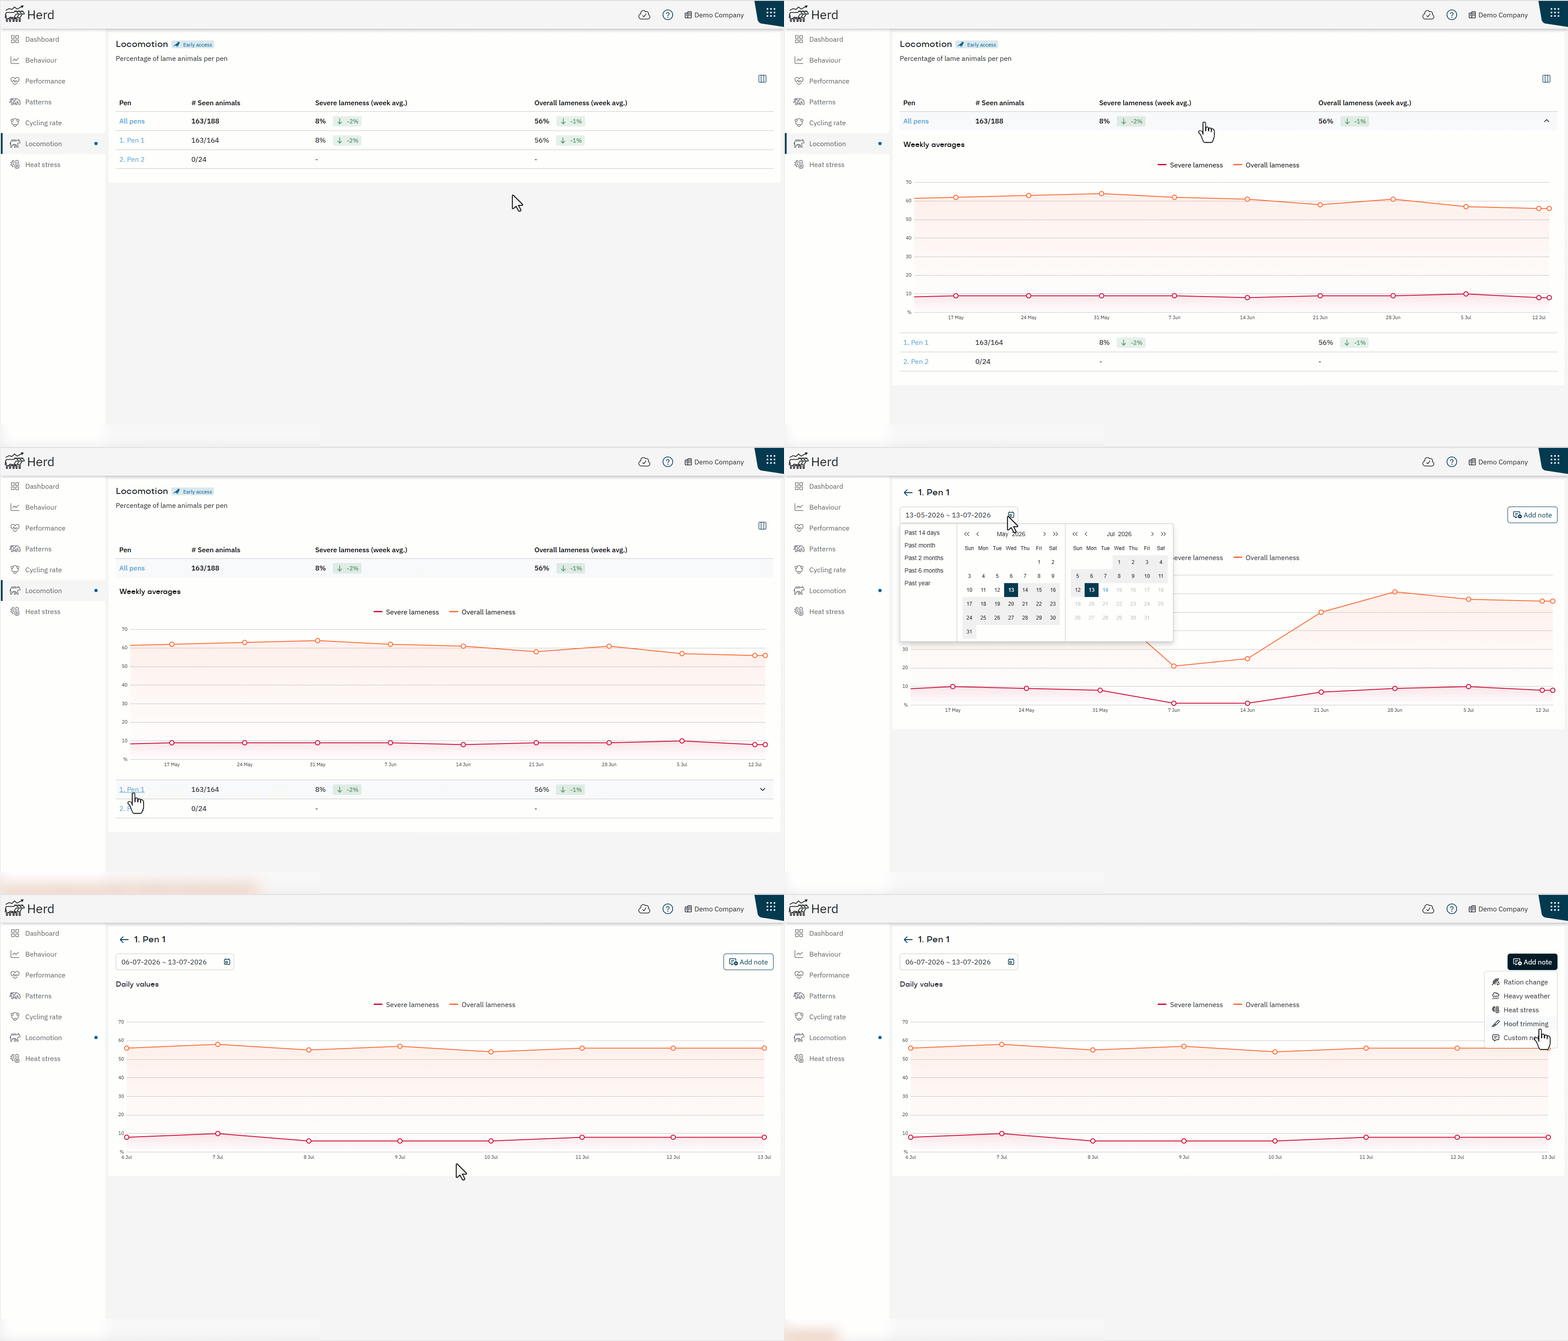
- Click on a row to expand the graph.
- Review the Overall and Severe lameness rates during the past 60 days.
- Hover over a point in the graph to view the number of animals included and to calculate the exact value.
- To analyze an individual pen in more detail, select the pen name. This opens the pen detail page.
- On the pen detail page, select the period you want to analyze.]
The graph adjusts to the selected period:
For periods of up to three weeks, Daily values are shown.
For periods longer than three weeks, Weekly averages are shown.
3. Add notes
Use notes to record events that might explain changes in the graph, such as trimming activities or treatment changes. Also see Add Context to Performance Trends with Notes for more detailed information about adding notes.
- Open the detail page for All pens or an individual pen.
- Select Add note.
- Enter the details and save the note.
NoteWhen you add a note from All pens, the note applies to the entire farm.
