Use the Heat Stress tab in the Herd app to monitor current and historical heat stress levels across your herd. Review heat stress trends by pen, identify high-risk periods, and take action to protect animal health and maintain productivity.
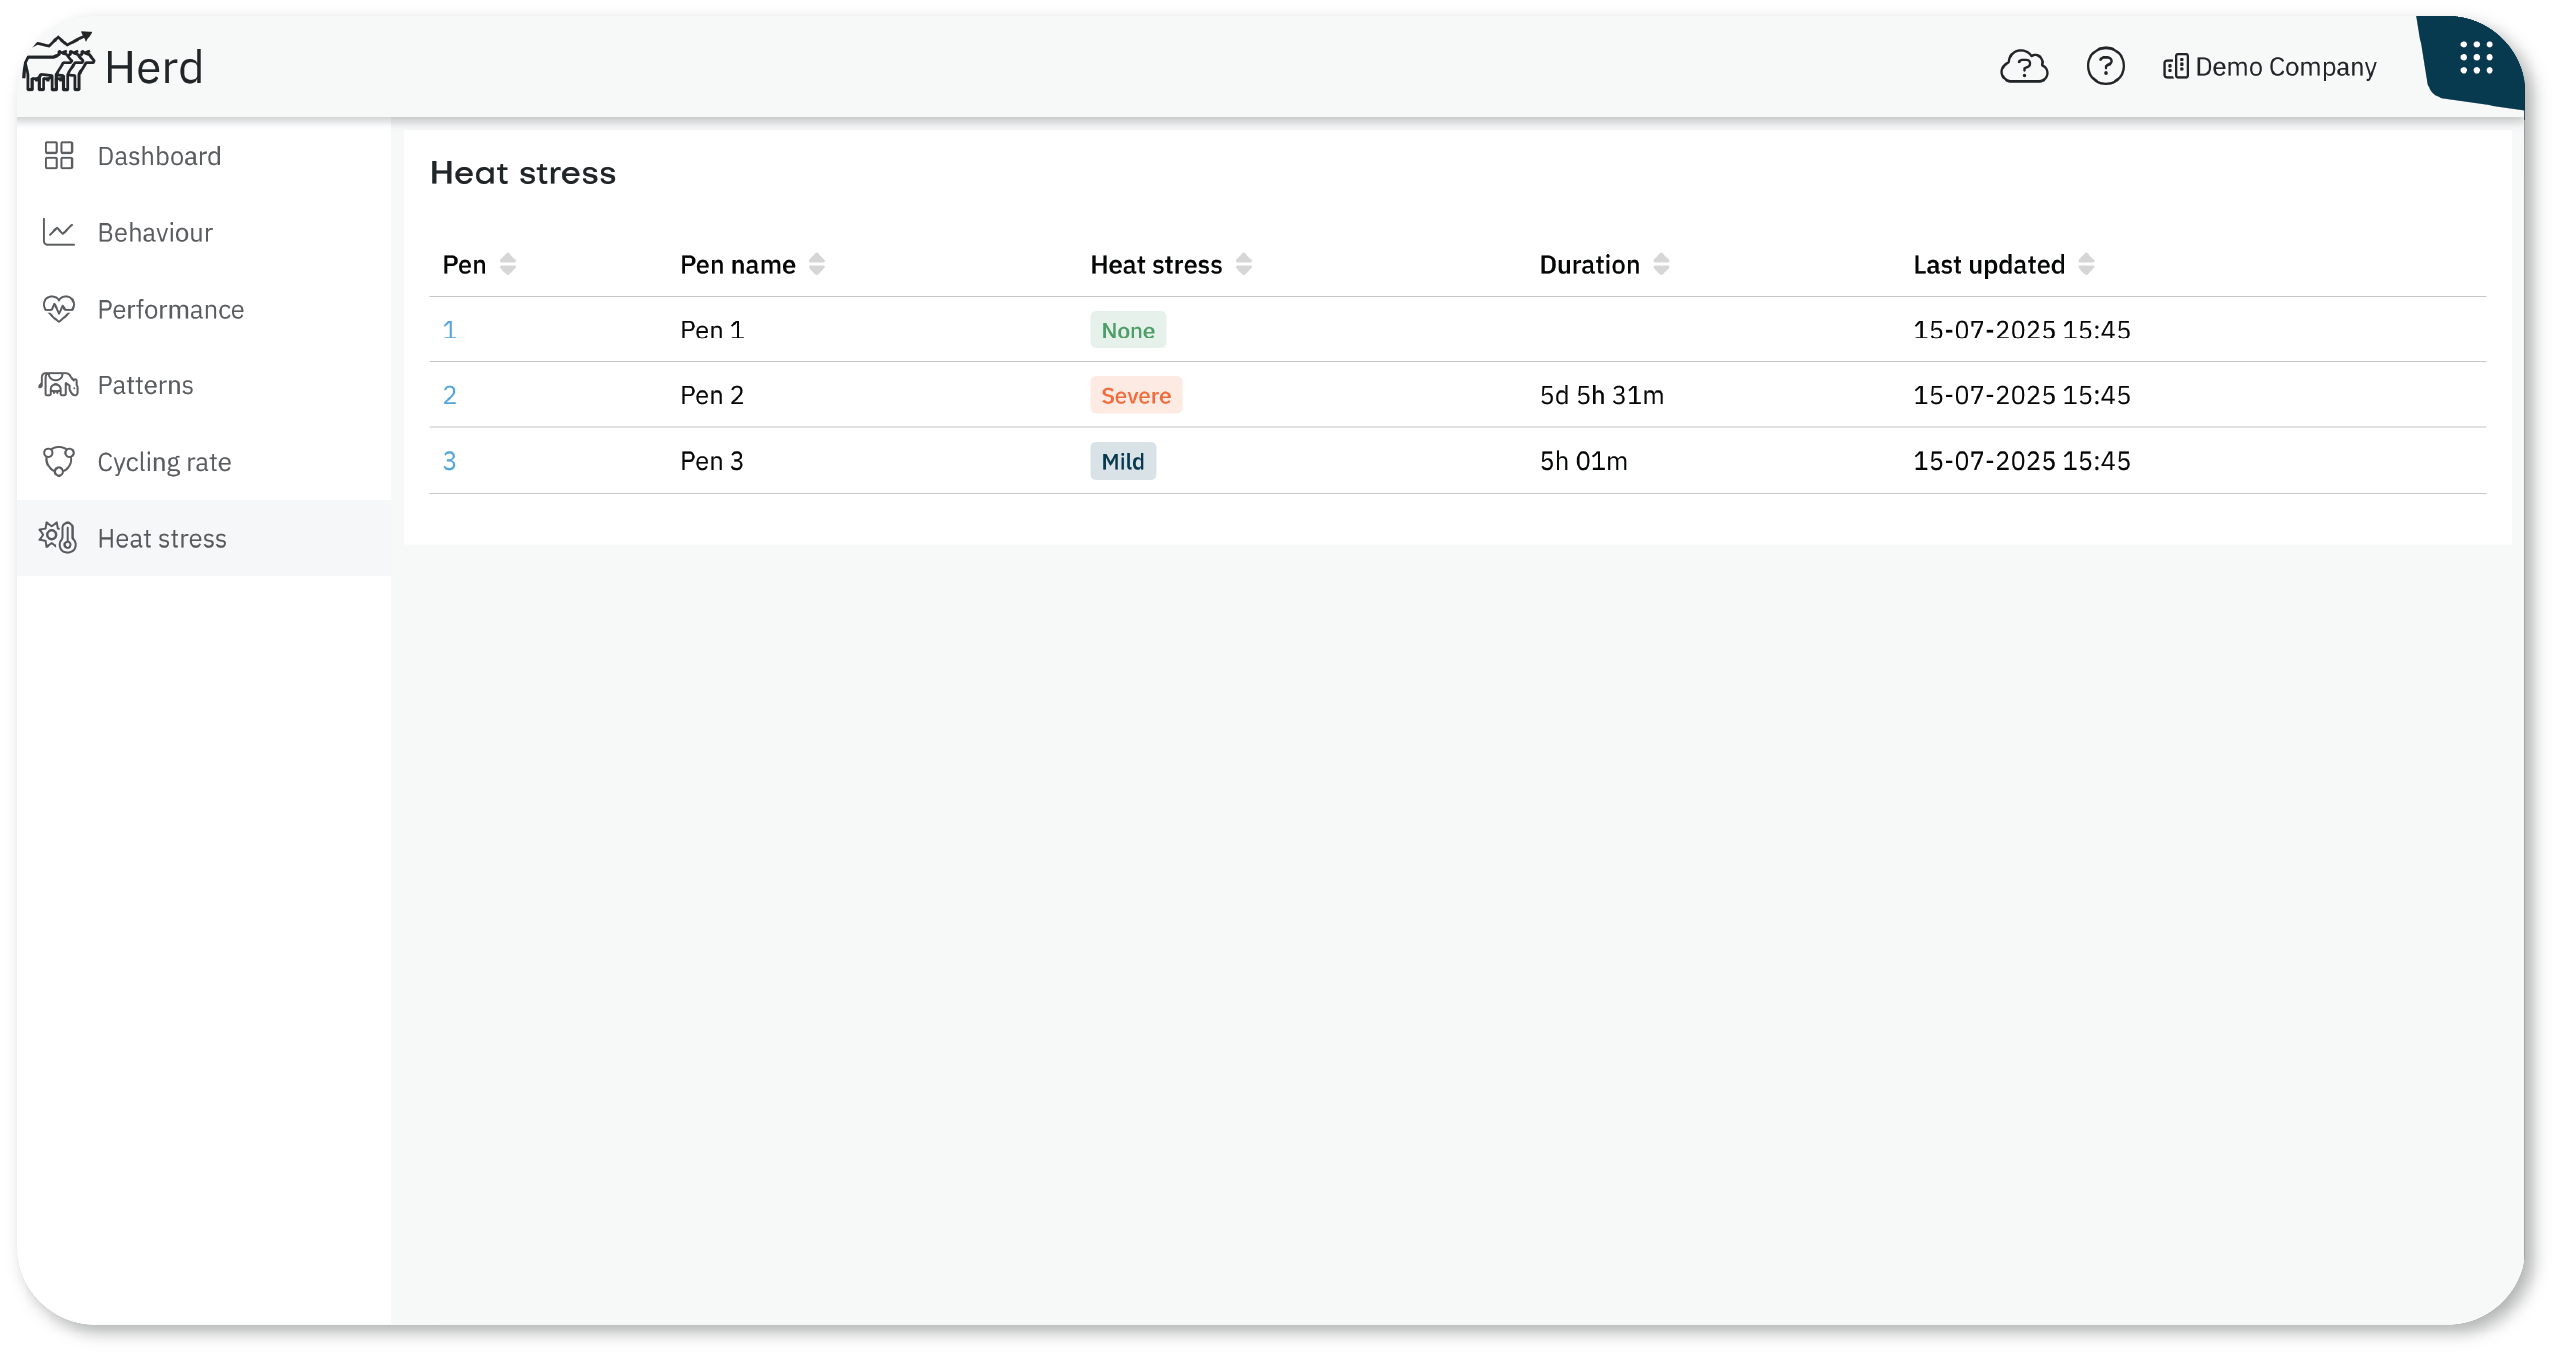
What you See on the Heat Stress Tab
Each pen displays the following information:
Heat stress level: One of four levels is displayed. These levels are estimations of the Temperature Humidty Index (THI).
None (green).
Mild (yellow).
Severe (orange).
Very severe (red).
Duration: How long the pen has been experiencing the current heat stress level.
Last update: Timestamp of the latest heat stress calculation, refreshed every 15 minutes.
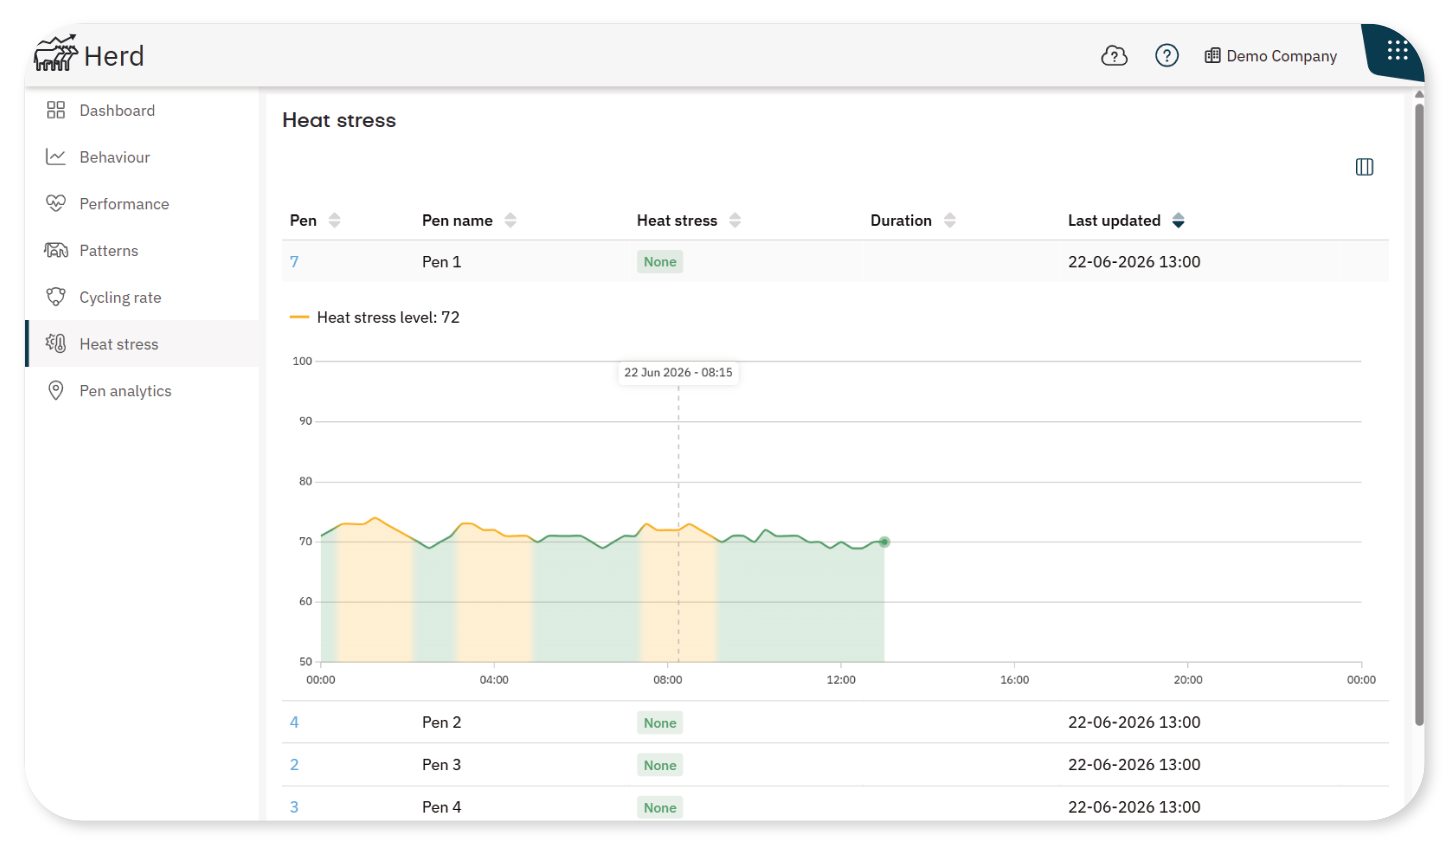
Daily heat stress trend: Expand the pen's row to view the 24-hour heat stress trend.
x-axis: Time
y-axis: Temperature Humidity Index (THI) estimation. The color of the graph corresponds to the heat stress level as explained above.
Pen notes: Add notes on any day with significant heat stress. These notes appear across other herd graphs for future reference.
Pen: Select the pen to open the pen's heat stress history and review past heat stress events.
Pen Details Page
From the overview, select the pen number to go to the pen details page. On this page, use the charts to identify heat stress events, review their severity, and analyze trends over time.
Daily details are available for the past 60 days, including days without recorded heat stress. You can select any day in the history chart to review its 24-hour heat stress trend.
The page contains two graphs that help you analyze heat stress over time.
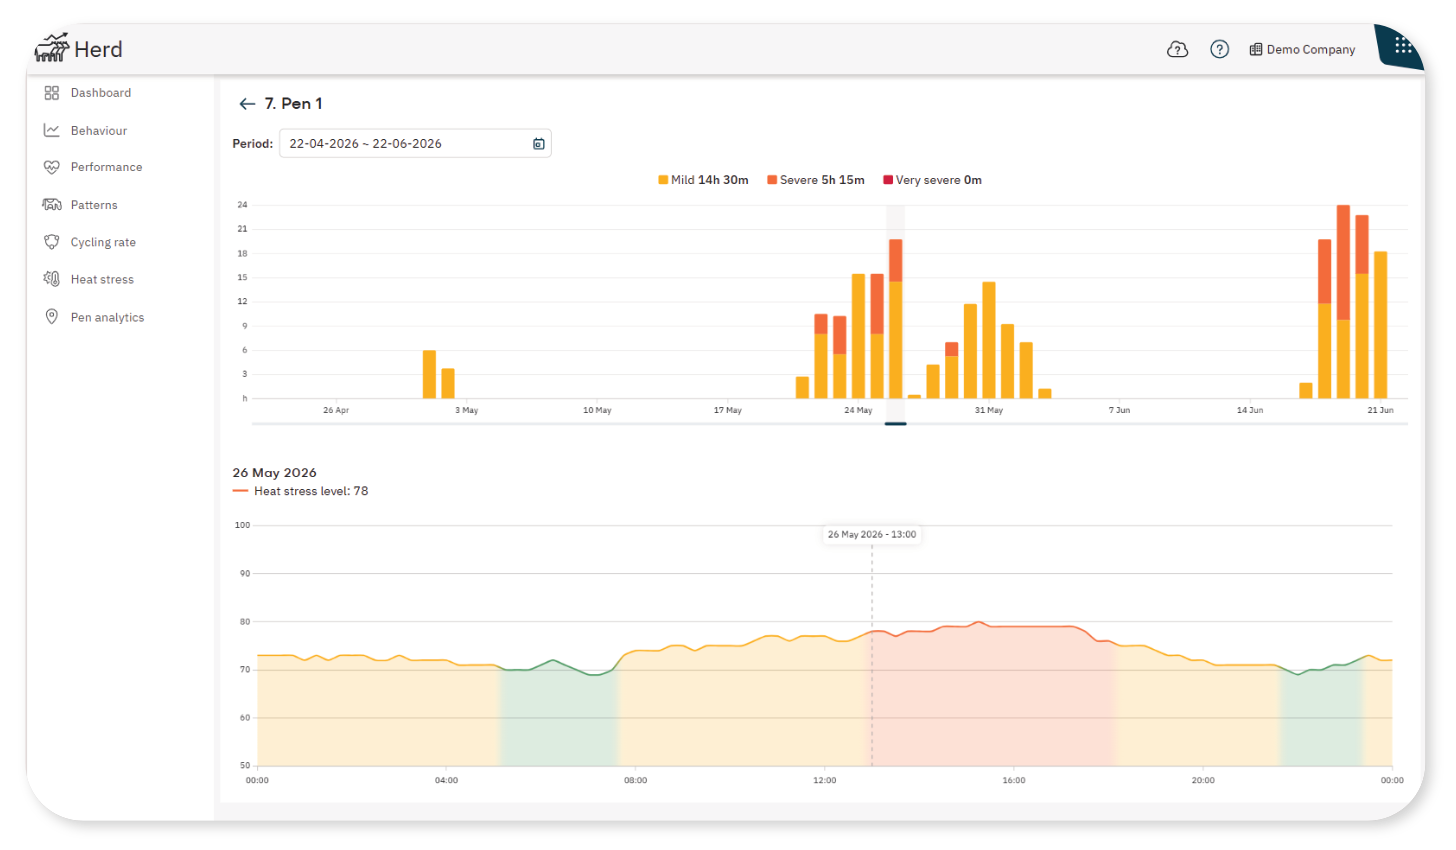
Heat Stress History
The bar chart at the top of the page shows daily summaries of heat stress events for the selected pen.
- The x-axis shows the days.
- The y-axis shows the total duration of heat stress for each day.
- Each bar is divided into the following heat stress categories:
- Mild (yellow)
- Severe (orange)
- Very severe (red)
Use this chart to compare heat stress levels across multiple days and identify days with increased heat stress.
To view detailed information for a specific day, select a day.
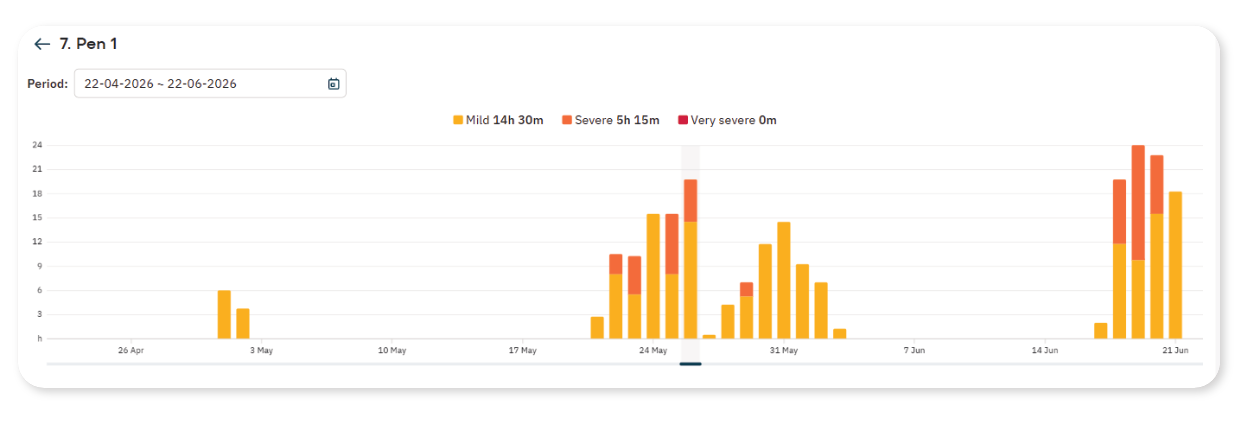
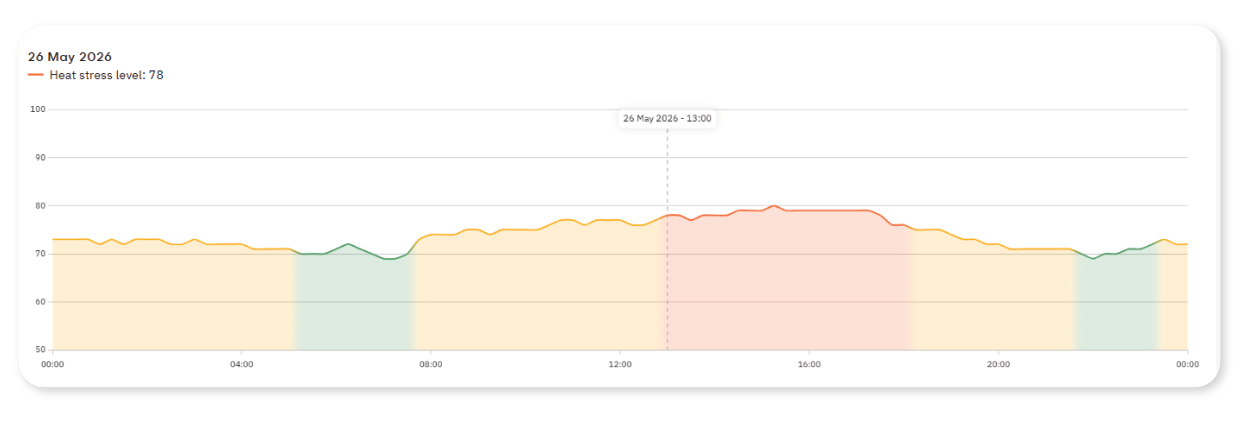
Daily Heat Stress Trend
After you select a day, a line graph is displayed below the bar chart.
- The x-axis shows the time during the selected 24-hour period.
- The y-axis shows the heat stress score.
- The colors correspond to the heat stress level: none (green), mild (yellow), severe (orange), very severe (red).
- Higher values indicate more severe heat stress conditions.
- Use this graph to identify when heat stress occurred during the day and how the severity changed over time.
Requirements
- Available with SmartTags (I)FER(P)4 or (I)FER(P)9 from 2021 or later.
- Latest Velos version is required.
- At least 20 SmartTags must have reported data from the pen in the last 15 minutes.
- Readings may be unavailable if animals are out of range during grazing.
Best Practices
- Monitor heat stress levels in the morning and afternoon during warm periods.
- Select individual pens to review when heat stress began and how long it lasted.
- Adapt heat protocols and monitor the effects on hot days.
- Add notes to document severe events and their impact on herd behavior or performance.
- Review historical data after warm periods to evaluate heat stress patterns.
