The transition period is one of the most critical periods in a cow’s lactation cycle. Proper management around dry-off and calving can help limit risks and support a healthy start to the next lactation.
Use Transition Monitoring in the Herd app to analyze how groups of animals perform around dry-off and calving. To evaluate transition performance:
- Select one or more groups of animals you want to analyze.
- View and compare their average eating or rumination behavior around dry-off or calving.
- Check and compare the related key performance indicators.
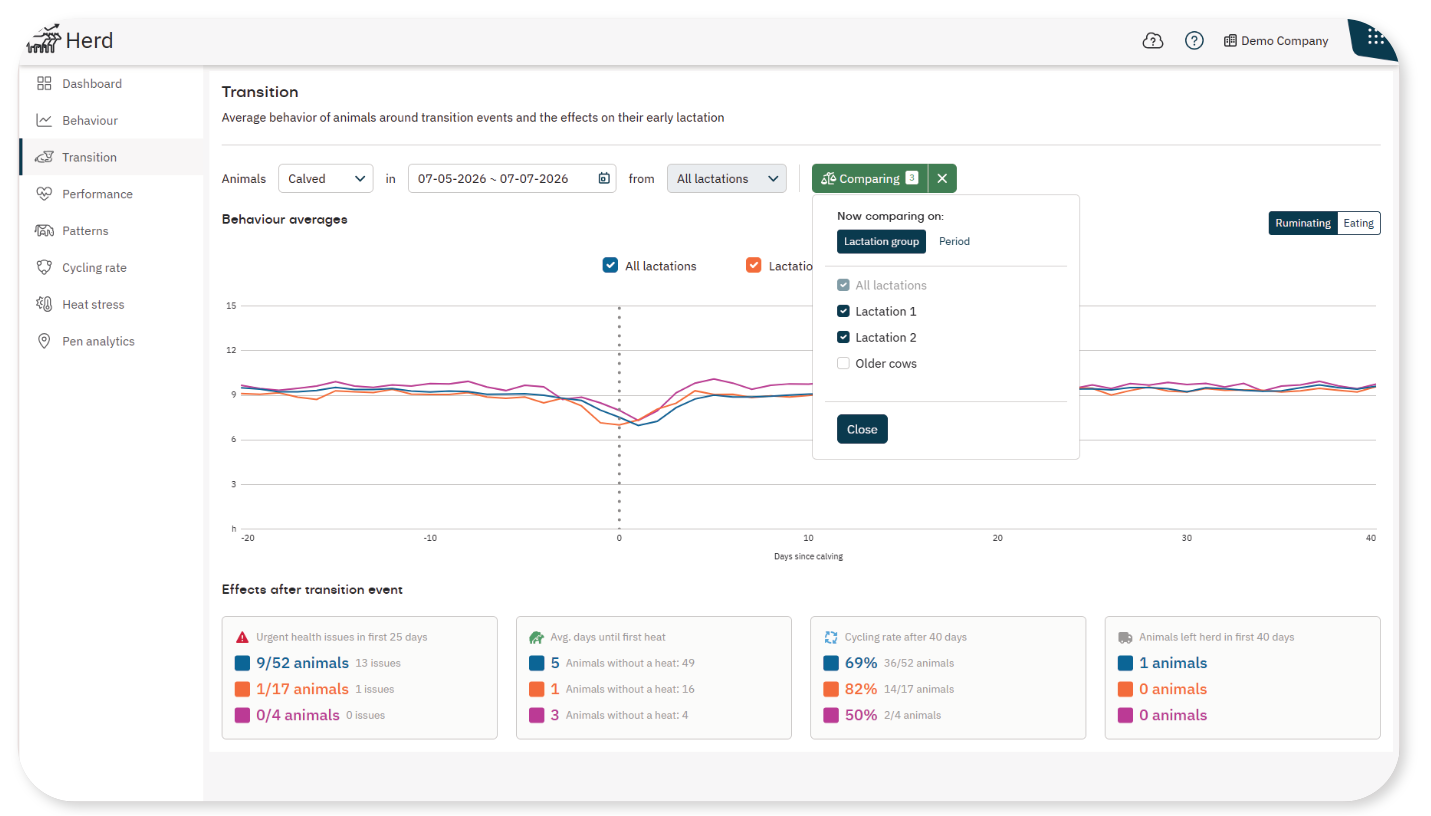
1. Select Animals to Analyze
Use the group selection to define which animals you want to include in the analysis.
You can select animals based on:
To compare multiple groups:
- Select Compare.
- Select the groups or time periods you want to compare. You can compare up to 7 groups at the same time.
- Select Close.
The selected group or groups determine which animals are included in the behavior chart and KPI calculations. Each group has its own color.
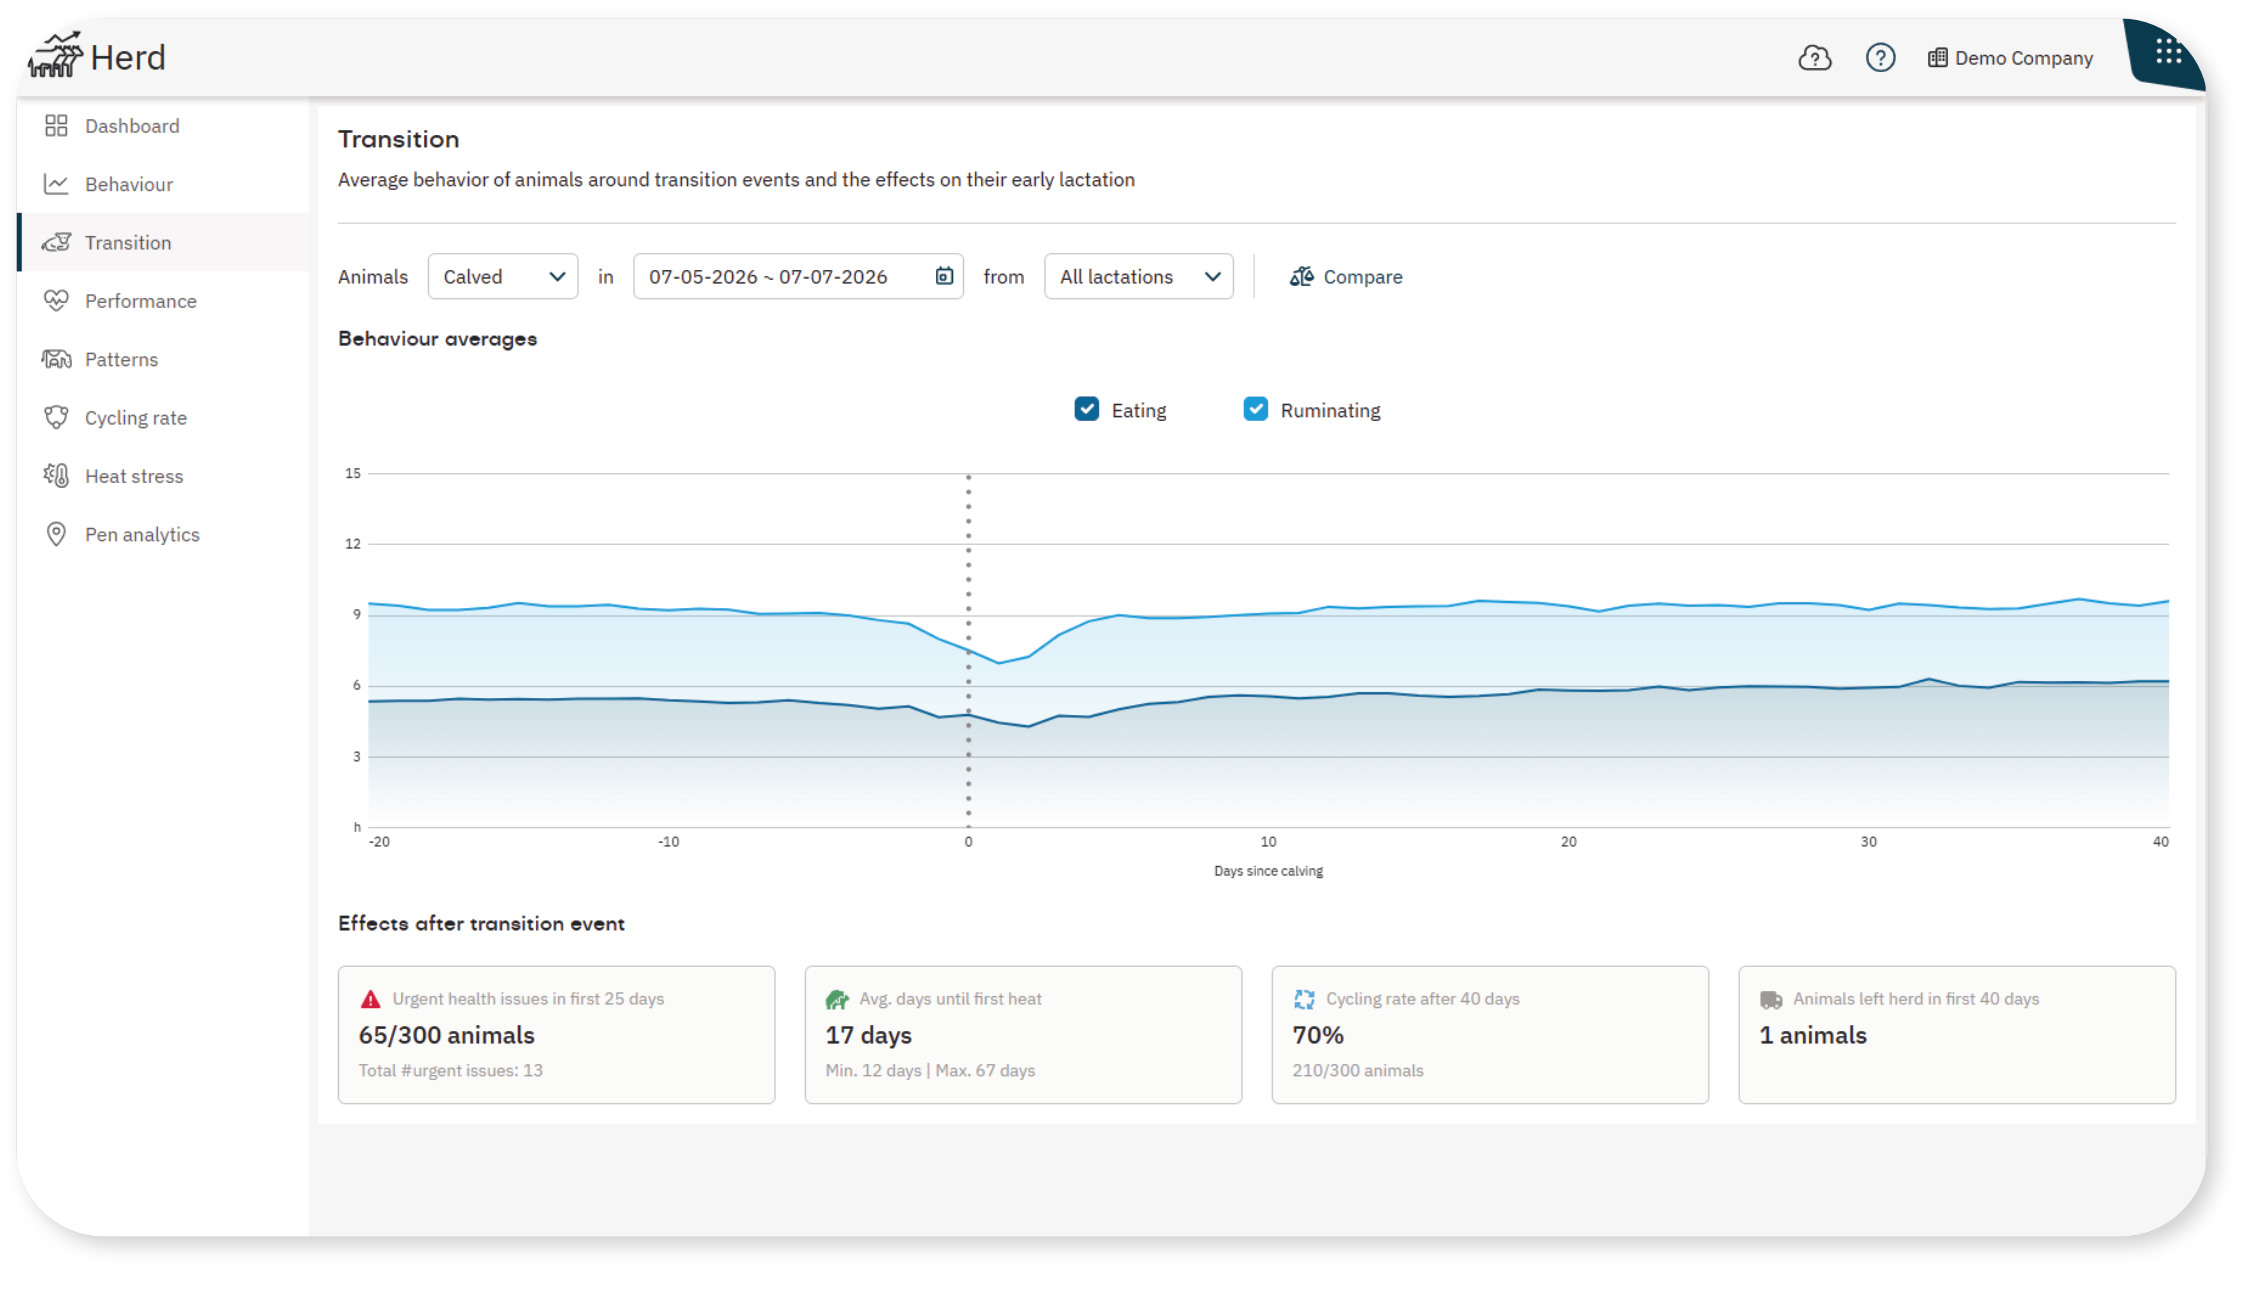
2. View Average Behavior Around Dry-off or Calving
The behavior chart helps you understand how eating and rumination patterns change before and after dry-off or calving.
Note- When one group is selected, the chart shows both eating and rumination behavior for that group.
- When multiple groups are selected, the chart shows either eating or rumination behavior for each group. You can switch between eating and rumination data to compare the selected groups.
How to Read the Chart
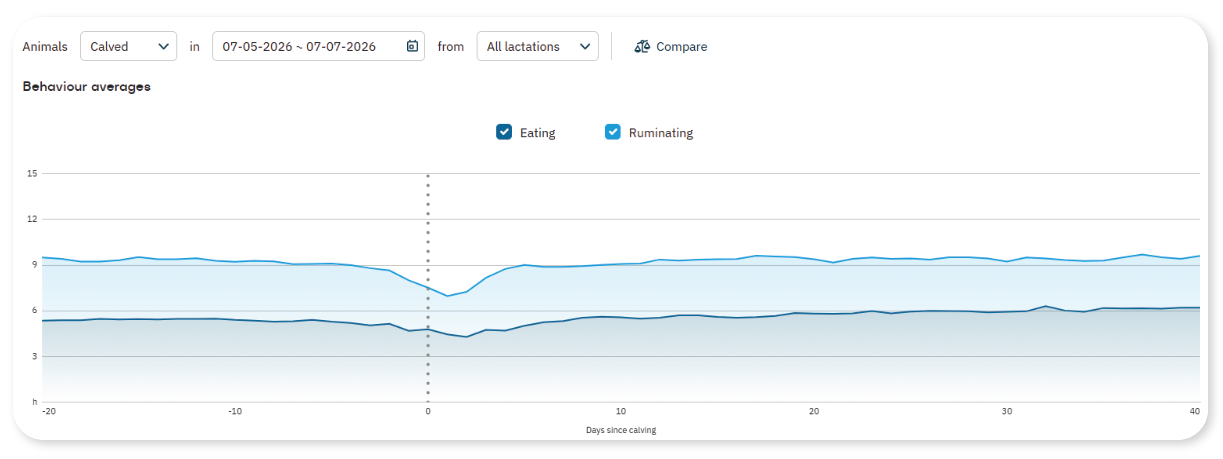
3. View Effects After Transition Event (coming soon)
This functionality is coming soon....
The 'Effects after transition event' section shows key performance indicators (KPIs) for the selected animals.
- The available KPIs depend on the selected event (dry-off or calving).
- When one group is selected, the KPI section shows the KPI values for that group.
- When multiple groups are selected, the KPI section shows the KPI values for each group, making it easier to compare transition performance between groups, periods, seasons, or farms.

Overview calving KPIs
The following KPIs are available for calving:
| KPI | Description |
|---|
| Animals with urgent health issue in first 25 days | The number of animals that had at least one urgent health alert in the first 25 days of lactation. |
| Average days until first heat | The average number of days until animals have their first green heat. |
| Cycling rate after 40 days | The percentage of animals cycling after 40 days. |
| Animals left herd after calving | The number of animals that left the herd after calving. |
Overview dry-off KPIs
The following KPIs are available for dry-off:
| KPI | Description |
|---|
| Urgent health issues in dry period | The number of animals that had at least one urgent health issue after dry-off and before calving. |
| Average days dry | The average number of days that animals were dry. |
| Animals left herd in dry period | The number of animals that left the herd during the dry period. |
Which Animals are Included in this Feature?
An animal is included in the chart when: The animal was wearing a SmartTag with FER functionality (Fertility, Eating, and Ruminating) during their dry-off or calving event.
All available behavior data is shown in the chart. If an animal is moved to another farm later in the transition period, the available data around the selected event is still included.
