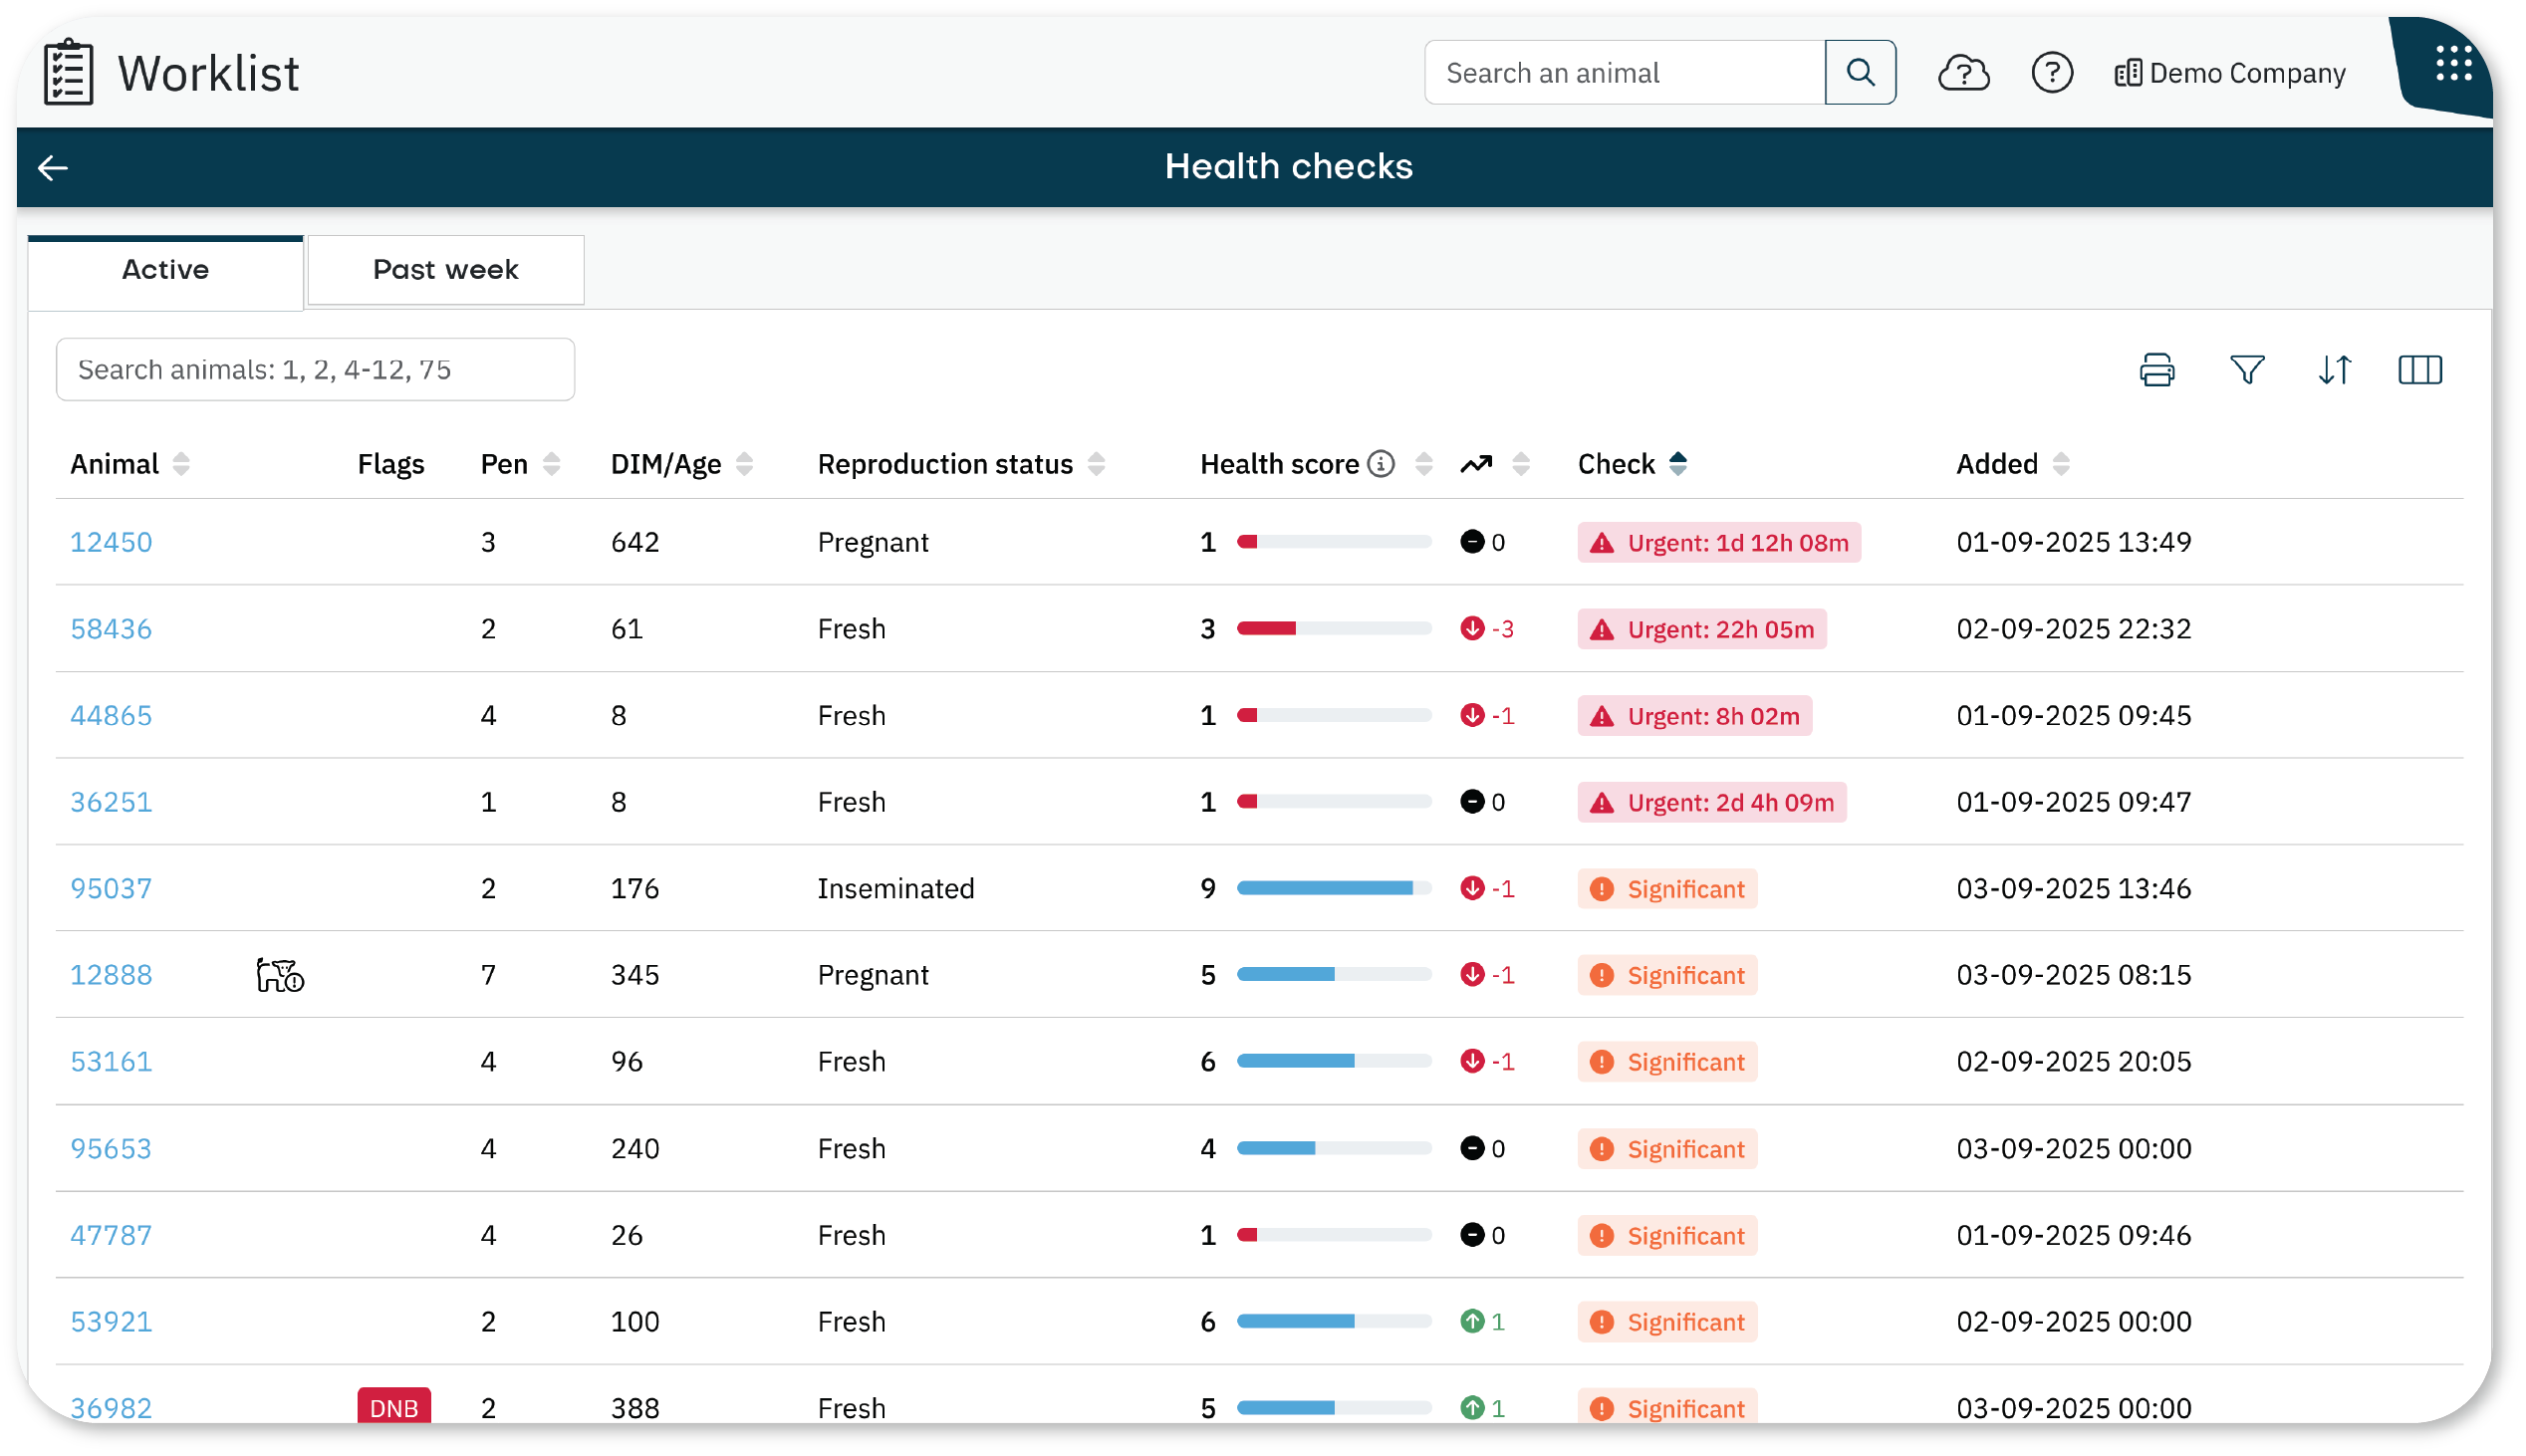
The Health Checks worklist helps you monitor animal well-being by detecting behavioral changes that may indicate health issues. It uses SmartTag data to alert you when animals deviate from normal patterns, allowing for early intervention.
How it works
Animals are automatically added based on behavior changes detected by SmartTag sensors.
Types of alerts:
Urgent: Severe changes, such as a complete stop in eating or ruminating. These animals are added immediately and cannot be removed manually.
Significant: A sharp increase in inactivity in the past 24 hours. These animals can be marked as Checked or No health issue.
Gradual: A consistent decline in eating or ruminating over the past five days. These animals can also be marked as Checked or No health issue.
NoteInactivity includes standing rest, lying rest, and sleep.
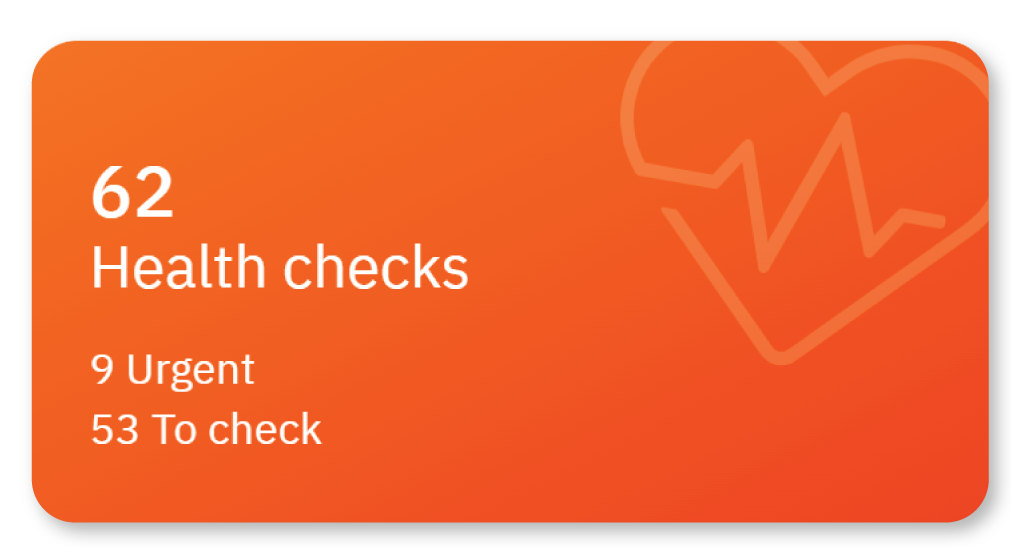
Dashboard Overview
On the Worklist dashboard, the Health Checks tile shows:
- Total: Number of animals needing a health check.
- Urgent: The number of animals requiring immediate attention.
- To check: The number of animals with significant or gradual changes.
Tile colors:
- Green: No animals need attention.
- Blue: Animals require a check.
- Orange: One or more animals need urgent attention.
Tabs Overview
The worklist has two tabs:
- Active: Lists animals currently needing a health check.
- Past week: Lists animals removed from the Active tab in the last 7 days.
NoteYou cannot remove animals with urgent alerts from the Active tab.
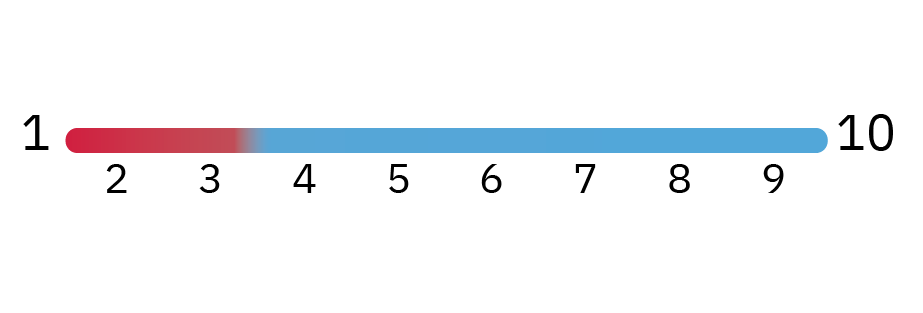
Health Score
The Health Score is a dynamic value (1 - 10) that reflects the animal’s current health based on:
- Behavior in the past 24 hours.
- Calendar data (age, lactation, DIM, days since pen change, days since last heat).
- Comparison with other animals on the farm.
Score details:
- Scores range from 1 (poor health) to 10 (excellent health).
- Colors:
- Red (1-3): Immediate attention is needed.
- Blue (4-10): Health is stable or good.
- Scores update every 15 minutes.
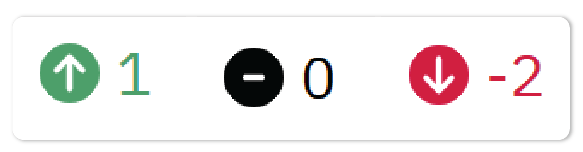
Health Score Trend
The Health Score Trend shows how an animal's health is changing over the past 6 hours.
- Values: 0, 1, 2, or 3,
- Visual cues:
↑ = Improving
↓ = Declining
— = Stable
Example of a Trend Change
An animal may have a high Health Score but a downward trend. This could signal early-stage issues and the need for action.
How to Use the Worklist
Focus on these columns:
- Check: Reason the animal is listed.
- Health score: Indicates severity.
- Health score trend: Shows whether health is improving or declining.
To view more details:
- Select the arrow icon to open the health graph.
- Select the animal number to open full details.
Icons in the Health Checks Worklist
Icons next to the animal number provide extra context:
| Icons |
 | Recently in heat Indicates that the animal was in heat recently. This could be a possible reason for deviating behavior. |
 | Calving stress For animals in late gestation. This indicates potential stress related to the upcoming calving event, typically when the cow has been carrying a calf for more than 275 days (DCC > 275).
Post-calving stress For recently calved animals. This signals that the cow may need additional support during the transition period, particularly in the first few days after calving (DIM <5).
|
|
|
 | SmartTag issue Indicates that the animal has a SmartTag issue, which could be a reason for the deviating data of the animal's behavior. |
Next Steps
After reviewing the Worklist, take actions such as:
See Handle Animals in the Health Checks Worklist for detailed instructions.
